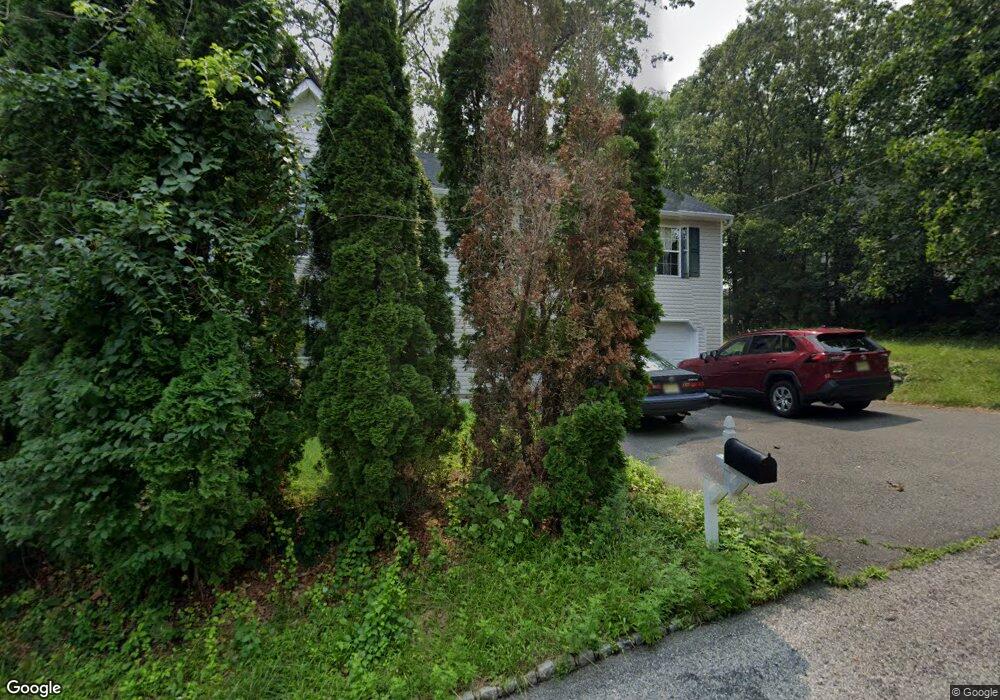
50 Unger Ave Stanhope, NJ 07874
Estimated Value: $492,129 - $517,000
--
Bed
--
Bath
1,932
Sq Ft
$262/Sq Ft
Est. Value
About This Home
This home is located at 50 Unger Ave, Stanhope, NJ 07874 and is currently estimated at $506,782, approximately $262 per square foot. 50 Unger Ave is a home located in Sussex County with nearby schools including Durban Avenue Elementary School, Hudson Maxim Elementary School, and Tulsa Trail Elementary School.
Ownership History
Date
Name
Owned For
Owner Type
Purchase Details
Closed on
Dec 30, 1998
Sold by
Chaplin Homes Inc
Bought by
Tan Weiming and Tan Jeanny C
Current Estimated Value
Home Financials for this Owner
Home Financials are based on the most recent Mortgage that was taken out on this home.
Original Mortgage
$145,600
Outstanding Balance
$33,509
Interest Rate
6.67%
Estimated Equity
$473,273
Purchase Details
Closed on
Jul 10, 1998
Sold by
Feher Janos and Feher John
Bought by
Chaplin Homes Inc
Create a Home Valuation Report for This Property
The Home Valuation Report is an in-depth analysis detailing your home's value as well as a comparison with similar homes in the area
Home Values in the Area
Average Home Value in this Area
Purchase History
| Date | Buyer | Sale Price | Title Company |
|---|---|---|---|
| Tan Weiming | $182,000 | Commonwealth Land Title Ins | |
| Chaplin Homes Inc | $11,800 | Old Republic Title |
Source: Public Records
Mortgage History
| Date | Status | Borrower | Loan Amount |
|---|---|---|---|
| Open | Tan Weiming | $145,600 |
Source: Public Records
Tax History Compared to Growth
Tax History
| Year | Tax Paid | Tax Assessment Tax Assessment Total Assessment is a certain percentage of the fair market value that is determined by local assessors to be the total taxable value of land and additions on the property. | Land | Improvement |
|---|---|---|---|---|
| 2025 | $8,246 | $395,500 | $117,100 | $278,400 |
| 2024 | $8,859 | $395,500 | $117,100 | $278,400 |
| 2023 | $8,859 | $253,200 | $75,600 | $177,600 |
| 2022 | $8,685 | $253,200 | $75,600 | $177,600 |
| 2021 | $8,538 | $253,200 | $75,600 | $177,600 |
| 2020 | $8,449 | $253,200 | $75,600 | $177,600 |
| 2019 | $8,414 | $253,200 | $75,600 | $177,600 |
| 2018 | $8,396 | $253,200 | $75,600 | $177,600 |
| 2017 | $8,383 | $253,200 | $75,600 | $177,600 |
| 2016 | $8,401 | $253,200 | $75,600 | $177,600 |
| 2015 | $8,211 | $253,200 | $75,600 | $177,600 |
| 2014 | $8,183 | $253,200 | $75,600 | $177,600 |
Source: Public Records
Map
Nearby Homes