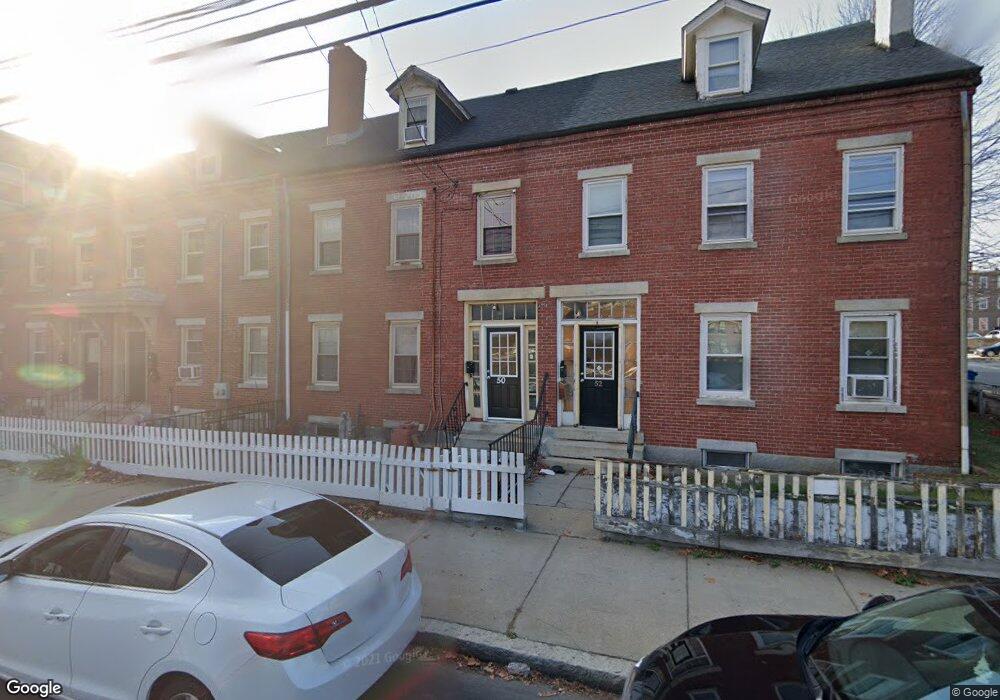
50 Union St Lawrence, MA 01840
Downtown Lawrence NeighborhoodEstimated Value: $396,000 - $534,000
5
Beds
1
Bath
1,830
Sq Ft
$249/Sq Ft
Est. Value
About This Home
This home is located at 50 Union St, Lawrence, MA 01840 and is currently estimated at $455,253, approximately $248 per square foot. 50 Union St is a home located in Essex County with nearby schools including School For Exceptional Studies, Community Day Charter Public School - Gateway, and Lawrence Catholic Academy.
Ownership History
Date
Name
Owned For
Owner Type
Purchase Details
Closed on
Jul 19, 2016
Sold by
Caras Realty Llc
Bought by
Ferreras Yenny
Current Estimated Value
Home Financials for this Owner
Home Financials are based on the most recent Mortgage that was taken out on this home.
Original Mortgage
$164,900
Outstanding Balance
$131,978
Interest Rate
3.66%
Mortgage Type
New Conventional
Estimated Equity
$323,275
Purchase Details
Closed on
Apr 9, 2010
Sold by
Hsbc Bank Usa and Ocwen Loan Servicing L
Bought by
Caras Realty Llc
Purchase Details
Closed on
Oct 29, 2009
Sold by
Auguste Suze and Hsbc Bank Usa
Bought by
Hsbc Bank Usa
Purchase Details
Closed on
May 11, 2007
Sold by
Nicotra Rosario Est and Nicotra
Bought by
Auguste Suze
Home Financials for this Owner
Home Financials are based on the most recent Mortgage that was taken out on this home.
Original Mortgage
$82,500
Interest Rate
6.21%
Mortgage Type
Purchase Money Mortgage
Create a Home Valuation Report for This Property
The Home Valuation Report is an in-depth analysis detailing your home's value as well as a comparison with similar homes in the area
Home Values in the Area
Average Home Value in this Area
Purchase History
| Date | Buyer | Sale Price | Title Company |
|---|---|---|---|
| Ferreras Yenny | $170,000 | -- | |
| Ferreras Yenny | $170,000 | -- | |
| Caras Realty Llc | $53,500 | -- | |
| Caras Realty Llc | $53,500 | -- | |
| Hsbc Bank Usa | $88,722 | -- | |
| Hsbc Bank Usa | $88,722 | -- | |
| Auguste Suze | $110,000 | -- | |
| Auguste Suze | $110,000 | -- |
Source: Public Records
Mortgage History
| Date | Status | Borrower | Loan Amount |
|---|---|---|---|
| Open | Ferreras Yenny | $164,900 | |
| Closed | Ferreras Yenny | $164,900 | |
| Previous Owner | Auguste Suze | $82,500 |
Source: Public Records
Tax History
| Year | Tax Paid | Tax Assessment Tax Assessment Total Assessment is a certain percentage of the fair market value that is determined by local assessors to be the total taxable value of land and additions on the property. | Land | Improvement |
|---|---|---|---|---|
| 2025 | $3,377 | $383,800 | $85,500 | $298,300 |
| 2024 | $3,258 | $352,200 | $89,800 | $262,400 |
| 2023 | $2,769 | $272,500 | $86,700 | $185,800 |
| 2022 | $2,671 | $233,500 | $81,800 | $151,700 |
| 2021 | $2,580 | $210,300 | $81,800 | $128,500 |
| 2020 | $2,602 | $209,300 | $68,200 | $141,100 |
| 2019 | $2,434 | $177,900 | $50,700 | $127,200 |
| 2018 | $2,214 | $154,600 | $45,900 | $108,700 |
| 2017 | $2,019 | $131,600 | $43,500 | $88,100 |
| 2016 | $1,940 | $125,100 | $34,000 | $91,100 |
| 2015 | $1,892 | $125,100 | $34,000 | $91,100 |
Source: Public Records
Map
Nearby Homes
- 80-82 Haverhill St
- 89 Newbury St Unit 89B
- 91 Summer St Unit 2
- 192 Union St
- 11 Lawrence St Unit 606
- 71-75 Common St
- 5 Kendrick St
- 46 Amesbury St Unit 2B
- 131A Lawrence St Unit 40
- 7 Stevens Ct
- 52 Howard St
- 162 E Haverhill St
- 109 Ferry St
- 27 Woodland Ct
- 2 Cherry St
- 7-9 Bennington St
- 129-131 Lexington St
- 202 Broadway Unit 3-2
- 202 Broadway Unit 3-3
- 151-153 Bailey St
- 52 Union St
- 48 Union St
- 48 Union St Unit 1
- 48 Union St Unit 2
- 46 Union St
- 44 Union St
- 44 Union St Unit Suite 1
- 6 Orchard St
- 8 Orchard St
- 10 Orchard St
- 54 Union St
- 40 Union St
- 103 Garden St Unit 1
- 5 Orchard St
- 5 Orchard St Unit 1
- 12 Orchard St
- 38 Union St
- 38 Union St Unit 2
- 109 Garden St
- 109 Garden St Unit 109A
Your Personal Tour Guide
Ask me questions while you tour the home.