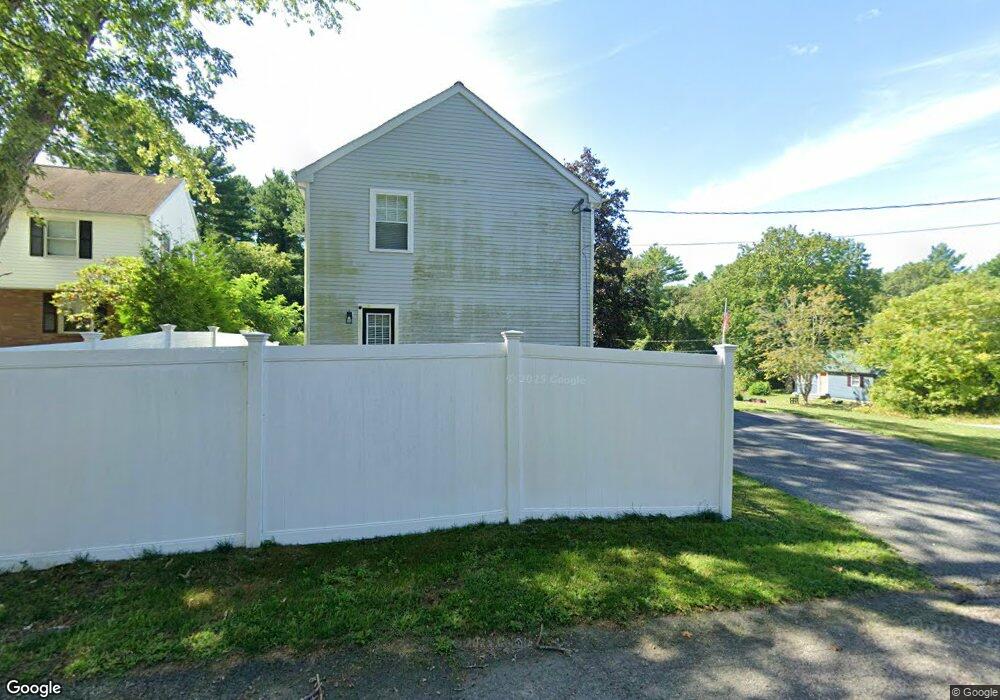
50 View St Middleborough, MA 02346
Estimated Value: $579,000 - $662,000
3
Beds
3
Baths
1,700
Sq Ft
$359/Sq Ft
Est. Value
About This Home
This home is located at 50 View St, Middleborough, MA 02346 and is currently estimated at $610,654, approximately $359 per square foot. 50 View St is a home located in Plymouth County with nearby schools including Mary K. Goode Elementary School.
Ownership History
Date
Name
Owned For
Owner Type
Purchase Details
Closed on
May 14, 2021
Sold by
50 View Street Llc
Bought by
Mcclain Tori and Mcclaim Jodie
Current Estimated Value
Home Financials for this Owner
Home Financials are based on the most recent Mortgage that was taken out on this home.
Original Mortgage
$380,036
Outstanding Balance
$344,408
Interest Rate
3.1%
Mortgage Type
FHA
Estimated Equity
$266,246
Purchase Details
Closed on
May 15, 2020
Sold by
Ramsay Steven and Ramsay Mary
Bought by
50 View St Llc
Create a Home Valuation Report for This Property
The Home Valuation Report is an in-depth analysis detailing your home's value as well as a comparison with similar homes in the area
Home Values in the Area
Average Home Value in this Area
Purchase History
| Date | Buyer | Sale Price | Title Company |
|---|---|---|---|
| Mcclain Tori | $415,000 | None Available | |
| 50 View St Llc | -- | None Available |
Source: Public Records
Mortgage History
| Date | Status | Borrower | Loan Amount |
|---|---|---|---|
| Open | Mcclain Tori | $380,036 |
Source: Public Records
Tax History
| Year | Tax Paid | Tax Assessment Tax Assessment Total Assessment is a certain percentage of the fair market value that is determined by local assessors to be the total taxable value of land and additions on the property. | Land | Improvement |
|---|---|---|---|---|
| 2025 | $7,244 | $540,200 | $160,300 | $379,900 |
| 2024 | $7,521 | $555,500 | $152,600 | $402,900 |
| 2023 | $6,820 | $478,900 | $152,600 | $326,300 |
| 2022 | $6,361 | $413,600 | $132,700 | $280,900 |
| 2021 | $6,368 | $391,400 | $122,000 | $269,400 |
| 2020 | $1,937 | $122,000 | $122,000 | $0 |
| 2019 | $1,889 | $122,000 | $122,000 | $0 |
| 2018 | $1,730 | $110,900 | $110,900 | $0 |
| 2017 | $1,681 | $106,600 | $106,600 | $0 |
| 2016 | $1,554 | $97,600 | $97,600 | $0 |
| 2015 | $1,540 | $97,600 | $97,600 | $0 |
Source: Public Records
Map
Nearby Homes
- 227 E Main St
- 308 Wood St
- 240 N Main St
- 6 Barrows St
- 620 Plymouth St
- 28 School St
- 26 Wareham St
- 0 Wareham Miller St Unit 73410845
- 17 Cobblestone Ln
- 18 Rock St
- 6 Rock St
- 80 Forest St
- 132 Everett St
- 15 Pearl St
- 10 Old Thompson St
- LOT A Wood St
- 246 Everett St
- 135 E Grove St
- 129 Thomas St
- 17 Landing Way Unit 17