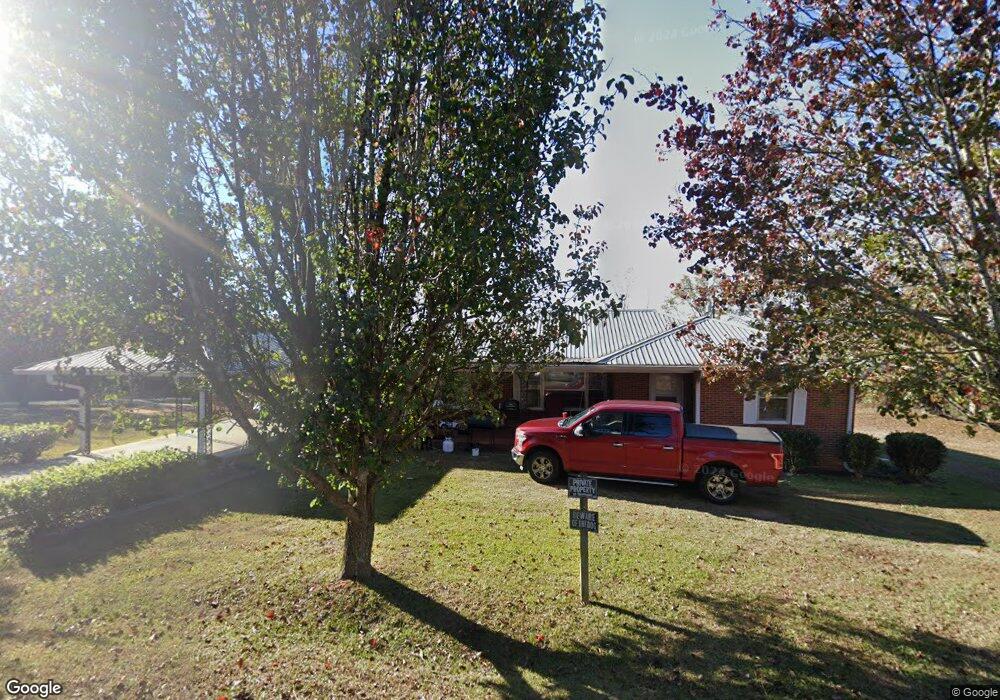
50 W Smith Rd West Point, GA 31833
Estimated Value: $185,713 - $242,000
4
Beds
2
Baths
1,912
Sq Ft
$117/Sq Ft
Est. Value
About This Home
This home is located at 50 W Smith Rd, West Point, GA 31833 and is currently estimated at $222,928, approximately $116 per square foot. 50 W Smith Rd is a home located in Troup County with nearby schools including West Point Elementary School, Long Cane Elementary School, and Berta Weathersbee Elementary School.
Ownership History
Date
Name
Owned For
Owner Type
Purchase Details
Closed on
Jul 18, 2016
Sold by
Renee
Bought by
Slaughter Bruce J
Current Estimated Value
Home Financials for this Owner
Home Financials are based on the most recent Mortgage that was taken out on this home.
Original Mortgage
$112,917
Outstanding Balance
$89,911
Interest Rate
3.75%
Mortgage Type
FHA
Estimated Equity
$133,017
Purchase Details
Closed on
Jun 27, 2008
Sold by
Hicks Vonner H
Bought by
Brem Renee and Brown Bronwyn
Purchase Details
Closed on
Dec 24, 1974
Sold by
Hull Shirley Nadine P
Bought by
Vonner H Hicks Jr Etal
Purchase Details
Closed on
Jan 1, 1973
Sold by
Hull Ralph and Hull Betty
Bought by
Hull Shirley Nadine P
Purchase Details
Closed on
Sep 1, 1970
Sold by
Hull Eddie E and Hull Nadine
Bought by
Hull Ralph and Hull Betty
Purchase Details
Closed on
Mar 28, 1967
Sold by
Prather W G
Bought by
Hull Eddie E and Hull Nadine
Create a Home Valuation Report for This Property
The Home Valuation Report is an in-depth analysis detailing your home's value as well as a comparison with similar homes in the area
Home Values in the Area
Average Home Value in this Area
Purchase History
| Date | Buyer | Sale Price | Title Company |
|---|---|---|---|
| Slaughter Bruce J | $115,000 | -- | |
| Brem Renee | -- | -- | |
| Vonner H Hicks Jr Etal | $27,000 | -- | |
| Hull Shirley Nadine P | $17,500 | -- | |
| Hull Ralph | $22,500 | -- | |
| Hull Eddie E | -- | -- |
Source: Public Records
Mortgage History
| Date | Status | Borrower | Loan Amount |
|---|---|---|---|
| Open | Slaughter Bruce J | $112,917 |
Source: Public Records
Tax History
| Year | Tax Paid | Tax Assessment Tax Assessment Total Assessment is a certain percentage of the fair market value that is determined by local assessors to be the total taxable value of land and additions on the property. | Land | Improvement |
|---|---|---|---|---|
| 2025 | $1,731 | $74,772 | $5,360 | $69,412 |
| 2024 | $1,731 | $63,452 | $5,360 | $58,092 |
| 2023 | $1,618 | $59,332 | $5,360 | $53,972 |
| 2022 | $1,654 | $59,252 | $5,360 | $53,892 |
| 2021 | $1,533 | $50,840 | $4,360 | $46,480 |
| 2020 | $1,533 | $50,840 | $4,360 | $46,480 |
| 2019 | $1,416 | $46,960 | $4,000 | $42,960 |
| 2018 | $1,298 | $43,040 | $4,000 | $39,040 |
| 2017 | $1,298 | $43,040 | $4,000 | $39,040 |
| 2016 | $1,265 | $41,935 | $4,000 | $37,935 |
| 2015 | $1,278 | $42,316 | $4,381 | $37,935 |
| 2014 | $1,220 | $40,320 | $4,381 | $35,938 |
| 2013 | -- | $42,301 | $4,381 | $37,920 |
Source: Public Records
Map
Nearby Homes
- 206 Ann Murphy Rd
- 0 Ga Highway 0116 Unit 10619139
- 508 Pine St
- 1903 Ridgewood Dr
- 1800 Malco Dr
- 0 Sunset Dr Unit 10451831
- 4517 Georgia 18
- 4509 Georgia 18
- 4523 Georgia 18
- 4527 Georgia 18
- 1314 4th Ave
- 1202 E 9th St
- 0 Arrowhead Dr Unit 10451860
- 1104 E 8th St
- 713 Avenue H
- 1105 E 7th St
- 1007 4th Ave
- 1095 County Road 212
- 1111 County Road 212
- 509 Cleveland St
Your Personal Tour Guide
Ask me questions while you tour the home.