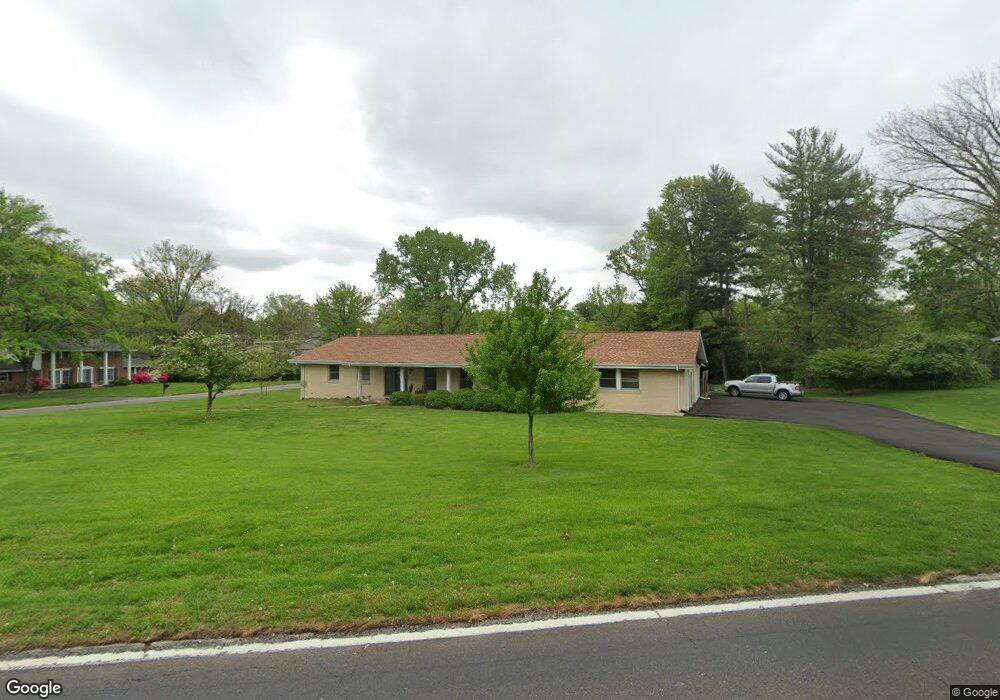
50 W Walling Dr Saint Louis, MO 63141
Estimated Value: $587,231 - $760,000
5
Beds
3
Baths
2,400
Sq Ft
$294/Sq Ft
Est. Value
About This Home
This home is located at 50 W Walling Dr, Saint Louis, MO 63141 and is currently estimated at $705,808, approximately $294 per square foot. 50 W Walling Dr is a home located in St. Louis County with nearby schools including Bellerive Elementary School, Parkway Northeast Middle School, and Parkway North High School.
Ownership History
Date
Name
Owned For
Owner Type
Purchase Details
Closed on
May 5, 2017
Sold by
Wild Randy and Wild Tiffany
Bought by
Silk Norma
Current Estimated Value
Home Financials for this Owner
Home Financials are based on the most recent Mortgage that was taken out on this home.
Original Mortgage
$220,000
Outstanding Balance
$183,606
Interest Rate
4.23%
Mortgage Type
New Conventional
Estimated Equity
$522,202
Purchase Details
Closed on
Mar 13, 2017
Sold by
Bartke Ann M and Gleason Marilyn R
Bought by
Wild Randy and Wild Tiffany
Home Financials for this Owner
Home Financials are based on the most recent Mortgage that was taken out on this home.
Original Mortgage
$220,000
Outstanding Balance
$183,606
Interest Rate
4.23%
Mortgage Type
New Conventional
Estimated Equity
$522,202
Purchase Details
Closed on
Sep 20, 2016
Sold by
Secrest Patricia A
Bought by
Bartke Ann M
Purchase Details
Closed on
May 5, 2016
Sold by
Bartke Ann M
Bought by
Bartke Ann M and Secrest Patricia A
Create a Home Valuation Report for This Property
The Home Valuation Report is an in-depth analysis detailing your home's value as well as a comparison with similar homes in the area
Home Values in the Area
Average Home Value in this Area
Purchase History
| Date | Buyer | Sale Price | Title Company |
|---|---|---|---|
| Silk Norma | $420,000 | Investors Title Co Clayton | |
| Wild Randy | $282,400 | -- | |
| Bartke Ann M | -- | None Available | |
| Bartke Ann M | -- | None Available |
Source: Public Records
Mortgage History
| Date | Status | Borrower | Loan Amount |
|---|---|---|---|
| Open | Silk Norma | $220,000 | |
| Previous Owner | Wild Randy | $240,000 | |
| Previous Owner | Wild Randy | -- |
Source: Public Records
Tax History
| Year | Tax Paid | Tax Assessment Tax Assessment Total Assessment is a certain percentage of the fair market value that is determined by local assessors to be the total taxable value of land and additions on the property. | Land | Improvement |
|---|---|---|---|---|
| 2025 | $6,428 | $135,750 | $71,170 | $64,580 |
| 2024 | $6,428 | $95,110 | $62,280 | $32,830 |
| 2023 | $6,428 | $95,110 | $62,280 | $32,830 |
| 2022 | $6,098 | $85,650 | $53,390 | $32,260 |
| 2021 | $6,062 | $85,650 | $53,390 | $32,260 |
| 2020 | $6,401 | $86,760 | $61,090 | $25,670 |
| 2019 | $6,264 | $86,760 | $61,090 | $25,670 |
| 2018 | $6,766 | $86,980 | $34,920 | $52,060 |
| 2017 | $6,567 | $86,980 | $34,920 | $52,060 |
| 2016 | $5,633 | $71,610 | $34,920 | $36,690 |
| 2015 | $5,903 | $71,610 | $34,920 | $36,690 |
| 2014 | $5,213 | $67,920 | $17,040 | $50,880 |
Source: Public Records
Map
Nearby Homes
- 327 Chasselle Ln
- 12759 Ladue Rd
- 274 Falling Leaves Ct
- 840 Angleterre Dr
- 170 Ambleside Ln
- 724 Bergerac Dr
- 815 Ariege Dr
- 13232 Dartagnan Ct
- 958 Somerfor Place Unit 2G
- 913 Maison Ladue Dr Unit 3R
- 924 Fernview Dr
- 765 Turrentine Trail
- 1126 Rue La Chelle Walk Unit 1126
- 1068 Fernview Dr
- 1151 Mill Crossing Dr Unit 205
- 404 Conway Gardens Ln
- 13337 Bragstadt Dr
- 442 Royalwood Dr
- 13101 Mill Crossing Ct Unit 302
- 13115 Mill Crossing Ct Unit 307
- 415 N Mason Rd
- 2 W Walling Dr
- 3 W Walling Dr
- 49 W Walling Dr
- 831 Coulange Ct
- 1 W Walling Dr
- 845 Coulange Ct
- 423 N Mason Rd
- 823 Coulange Ct
- 4 W Walling Dr
- 48 Auburndale Dr
- 811 Coulange Ct
- 851 Coulange Ct
- 47 Auburndale Dr
- 435 N Mason Rd
- 5 W Walling Dr
- 31 Auburndale Dr
- 46 Auburndale Dr
- 12801 Coulange Ct
- 49 Muirfield Ln
Your Personal Tour Guide
Ask me questions while you tour the home.