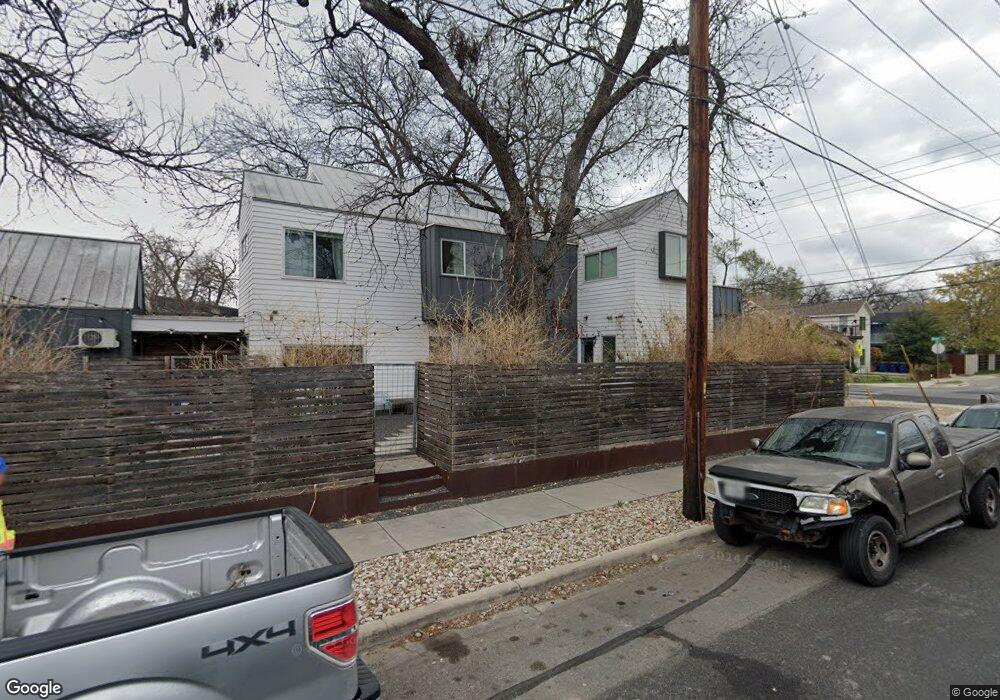
50 Waller St Unit B Austin, TX 78702
East Cesar Chavez NeighborhoodEstimated Value: $1,148,000 - $1,606,792
4
Beds
3
Baths
2,200
Sq Ft
$647/Sq Ft
Est. Value
About This Home
This home is located at 50 Waller St Unit B, Austin, TX 78702 and is currently estimated at $1,424,448, approximately $647 per square foot. 50 Waller St Unit B is a home located in Travis County with nearby schools including Sánchez Elementary School, Martin Middle School, and Austin High School.
Ownership History
Date
Name
Owned For
Owner Type
Purchase Details
Closed on
Jan 20, 2023
Sold by
Robertson Brian
Bought by
Lila Holdings Llc
Current Estimated Value
Purchase Details
Closed on
May 20, 2021
Sold by
Burns Kevin and Burns Paula Greenfield
Bought by
Robertson Brian
Home Financials for this Owner
Home Financials are based on the most recent Mortgage that was taken out on this home.
Original Mortgage
$1,020,000
Interest Rate
3.1%
Mortgage Type
New Conventional
Purchase Details
Closed on
Aug 15, 2013
Sold by
Karamalegos Ana Marie
Bought by
Burns Kevin
Purchase Details
Closed on
Jun 27, 2011
Sold by
Minahan Oil Co Llc
Bought by
Karamalegos Ana Marie
Purchase Details
Closed on
Oct 26, 2010
Sold by
Minahan Brenda S and Minahan Brenda Sue
Bought by
Minahan Oil Company Llc
Purchase Details
Closed on
Dec 19, 2006
Sold by
Schultz Leroy D
Bought by
Minahan Brenda S
Create a Home Valuation Report for This Property
The Home Valuation Report is an in-depth analysis detailing your home's value as well as a comparison with similar homes in the area
Home Values in the Area
Average Home Value in this Area
Purchase History
| Date | Buyer | Sale Price | Title Company |
|---|---|---|---|
| Lila Holdings Llc | -- | -- | |
| Robertson Brian | -- | Independence Title | |
| Burns Kevin | -- | None Available | |
| Karamalegos Ana Marie | -- | Chicago Title Co | |
| Minahan Oil Company Llc | -- | Bandera Title Company | |
| Minahan Brenda S | -- | None Available |
Source: Public Records
Mortgage History
| Date | Status | Borrower | Loan Amount |
|---|---|---|---|
| Previous Owner | Robertson Brian | $1,020,000 | |
| Closed | Burns Kevin | $0 |
Source: Public Records
Tax History
| Year | Tax Paid | Tax Assessment Tax Assessment Total Assessment is a certain percentage of the fair market value that is determined by local assessors to be the total taxable value of land and additions on the property. | Land | Improvement |
|---|---|---|---|---|
| 2025 | $28,455 | $1,390,414 | $497,415 | $892,999 |
| 2023 | $25,747 | $1,423,083 | $495,000 | $928,083 |
| 2022 | $41,156 | $2,083,936 | $495,000 | $1,588,936 |
| 2021 | $33,372 | $1,498,728 | $385,000 | $1,113,728 |
| 2020 | $29,022 | $1,353,096 | $385,000 | $968,096 |
| 2018 | $20,035 | $904,936 | $330,000 | $574,936 |
| 2017 | $17,103 | $766,895 | $302,500 | $464,395 |
| 2016 | $20,999 | $941,610 | $220,000 | $721,610 |
| 2015 | $9,248 | $741,509 | $220,000 | $521,509 |
| 2014 | $9,248 | $388,624 | $181,500 | $207,124 |
Source: Public Records
Map
Nearby Homes
- 1005 Holly St
- 40 Waller St
- 1212 Taylor St
- 1220 Taylor St
- 66 Cross St
- 1020 Spence St Unit B
- 1209 Canterbury St
- 40 N Interstate Hwy 35 Unit 6B3
- 40 N Interstate Highway 35 Unit 8C1
- 1302 Garden St
- 40 N Interstate 35 Unit 6D3
- 40 N Interstate 35 Unit 10B4
- 40 N Interstate 35 Unit 4A4
- 40 N Interstate 35 Unit 6C1
- 40 N Interstate 35 Unit 5B2
- 40 N Interstate 35 Unit 2C2
- 40 N Interstate 35 Unit 3D3
- 808 Spence St Unit A&B
- 48 East Ave Unit 2206
- 48 East Ave Unit 2509
- 50 Waller St Unit A
- 52 Waller St
- 52 Waller St Unit SI ID1244651P
- 52 Waller St Unit ID1244651P
- 52 Waller St Unit B
- 52 Waller St Unit A
- 53 Waller St Unit ID1244651P
- 1106 Lambie St Unit B
- 1106 Lambie St
- 1106 Lambie St Unit C
- 54 Waller St Unit A
- 54 Waller St
- 1200 Haskell St
- 1200 Haskell St Unit B
- 1200 Haskell St Unit A
- 48 Waller St Unit B
- 48 Waller St
- 48 Waller St Unit A
- 1107 Lambie St
- 1104 Lambie St
Your Personal Tour Guide
Ask me questions while you tour the home.