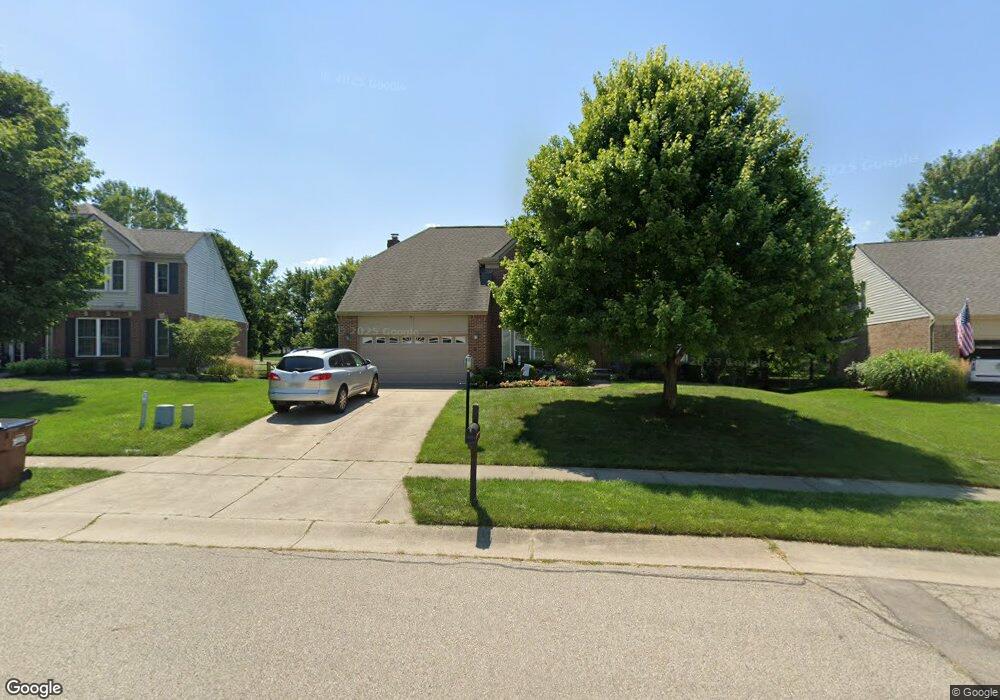
50 Wheatmore Ct Springboro, OH 45066
Estimated Value: $429,349 - $508,000
4
Beds
3
Baths
2,543
Sq Ft
$181/Sq Ft
Est. Value
About This Home
This home is located at 50 Wheatmore Ct, Springboro, OH 45066 and is currently estimated at $459,337, approximately $180 per square foot. 50 Wheatmore Ct is a home located in Warren County with nearby schools including Clearcreek Elementary School, Springboro Intermediate School, and Dennis Elementary School.
Ownership History
Date
Name
Owned For
Owner Type
Purchase Details
Closed on
Sep 4, 2019
Sold by
Thomas Joseph A
Bought by
Thomas Joseph Alan and Thomas Joseph Alan
Current Estimated Value
Purchase Details
Closed on
Nov 18, 2002
Sold by
Kralic David
Bought by
Thomas Joseph A and Thomas Teresa A
Home Financials for this Owner
Home Financials are based on the most recent Mortgage that was taken out on this home.
Original Mortgage
$185,000
Outstanding Balance
$75,023
Interest Rate
6.1%
Mortgage Type
New Conventional
Estimated Equity
$384,314
Purchase Details
Closed on
Sep 17, 1998
Sold by
Drees Co
Bought by
Kralic David A and Morrow Rose M
Home Financials for this Owner
Home Financials are based on the most recent Mortgage that was taken out on this home.
Original Mortgage
$202,900
Interest Rate
7.02%
Mortgage Type
New Conventional
Purchase Details
Closed on
Jan 31, 1997
Sold by
Robert C Rhein Interest
Bought by
The Drees Company
Create a Home Valuation Report for This Property
The Home Valuation Report is an in-depth analysis detailing your home's value as well as a comparison with similar homes in the area
Home Values in the Area
Average Home Value in this Area
Purchase History
| Date | Buyer | Sale Price | Title Company |
|---|---|---|---|
| Thomas Joseph Alan | -- | None Available | |
| Thomas Joseph A | $236,000 | -- | |
| Kralic David A | $225,900 | -- | |
| The Drees Company | $162,497 | -- |
Source: Public Records
Mortgage History
| Date | Status | Borrower | Loan Amount |
|---|---|---|---|
| Open | Thomas Joseph A | $185,000 | |
| Previous Owner | Kralic David A | $202,900 |
Source: Public Records
Tax History
| Year | Tax Paid | Tax Assessment Tax Assessment Total Assessment is a certain percentage of the fair market value that is determined by local assessors to be the total taxable value of land and additions on the property. | Land | Improvement |
|---|---|---|---|---|
| 2025 | $5,417 | $138,710 | $38,500 | $100,210 |
| 2024 | $5,417 | $138,710 | $38,500 | $100,210 |
| 2023 | $4,691 | $110,162 | $21,525 | $88,637 |
| 2022 | $4,622 | $110,163 | $21,525 | $88,638 |
| 2021 | $4,302 | $110,163 | $21,525 | $88,638 |
| 2020 | $4,000 | $89,562 | $17,500 | $72,062 |
| 2019 | $3,688 | $89,562 | $17,500 | $72,062 |
| 2018 | $3,691 | $89,562 | $17,500 | $72,062 |
| 2017 | $3,638 | $79,524 | $14,231 | $65,293 |
| 2016 | $3,794 | $79,524 | $14,231 | $65,293 |
| 2015 | $3,803 | $79,524 | $14,231 | $65,293 |
| 2014 | $3,897 | $77,210 | $13,820 | $63,390 |
| 2013 | $3,894 | $97,780 | $17,500 | $80,280 |
Source: Public Records
Map
Nearby Homes
- 210 Dan Haven Bend
- 175 Farmridge Rd
- 7 W Long Meadow Dr
- 50 Morris St
- 45 Morris St Unit 15
- 8 Glasgow St Unit 30
- 18 Glasgow St
- 65 Morris St Unit 17
- 45 Morris St
- 18 Glasgow St Unit 29
- 8 Glasgow St
- 30 Morris St
- 50 Morris St Unit 4
- 65 Morris St
- 330 East St
- 240 Bailey Ln
- 1045 W State Route 73
- 1045 Ohio 73
- 70 Waldwick Way
- 84 W Mill St
- 42 Wheatmore Ct
- 58 Wheatmore Ct
- 66 Wheatmore Ct
- 34 Wheatmore Ct
- 25 Wheatmore Ct
- 35 Wheatmore Ct
- 26 Wheatmore Ct
- 74 Wheatmore Ct
- 1616 W Lower Springboro Rd
- 24 E Handy Way
- 22 Mela Ct Unit Lt 22
- 20 Mela Ct Unit Lt 20
- 19 Mela Ct Unit Lt 19
- 18 Mela Ct Unit Lt 18
- 17 Mela Ct Unit Lt 17
- 13 Pesca Ln Unit Lt 13
- 12 Pesca Ln Unit Lt 12
- 0 E Handy Way Unit 24 1167930
- 18 Mela Ct
- 157 Maxwells Crossing
Your Personal Tour Guide
Ask me questions while you tour the home.