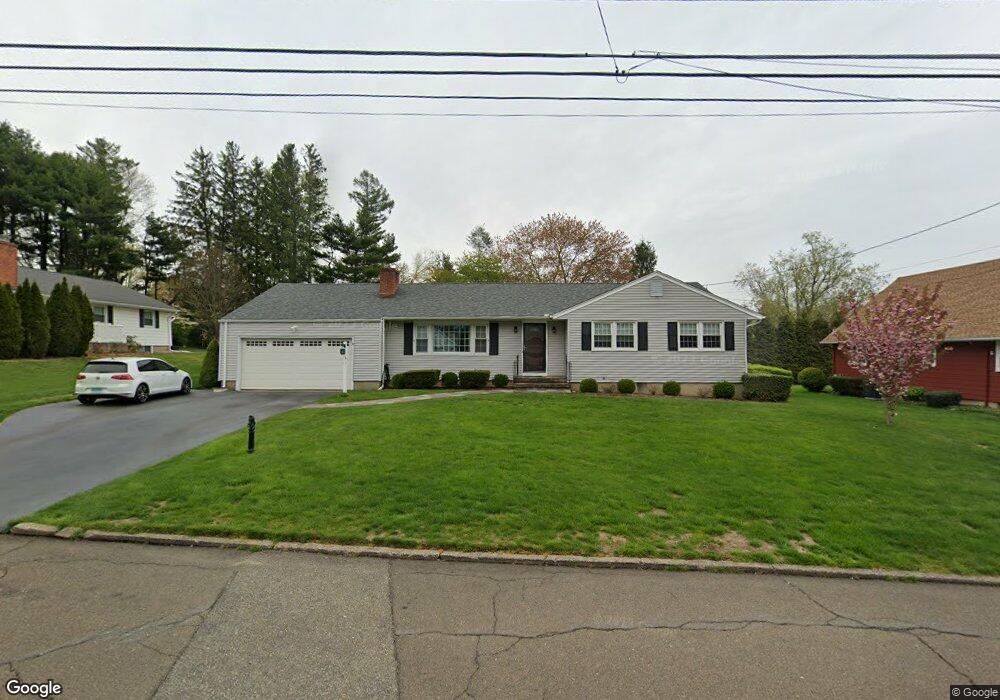
50 Wilbrook Rd Stratford, CT 06614
Estimated Value: $519,000 - $631,000
3
Beds
3
Baths
1,813
Sq Ft
$307/Sq Ft
Est. Value
About This Home
This home is located at 50 Wilbrook Rd, Stratford, CT 06614 and is currently estimated at $555,997, approximately $306 per square foot. 50 Wilbrook Rd is a home located in Fairfield County with nearby schools including Chapel Street Elementary School, Harry B. Flood Middle School, and Bunnell High School.
Ownership History
Date
Name
Owned For
Owner Type
Purchase Details
Closed on
Feb 1, 2001
Sold by
Larsen Carl W
Bought by
Gorman Thomas and Gorman Laura
Current Estimated Value
Home Financials for this Owner
Home Financials are based on the most recent Mortgage that was taken out on this home.
Original Mortgage
$145,000
Outstanding Balance
$52,611
Interest Rate
7.14%
Estimated Equity
$503,386
Purchase Details
Closed on
Aug 22, 1996
Sold by
Steel Gary R and Steel Susan E
Bought by
Larsen Carl W
Home Financials for this Owner
Home Financials are based on the most recent Mortgage that was taken out on this home.
Original Mortgage
$140,000
Interest Rate
8.4%
Mortgage Type
Unknown
Purchase Details
Closed on
Dec 5, 1991
Sold by
Barthelmess Madeline
Bought by
Steel Gary and Steel Susan
Home Financials for this Owner
Home Financials are based on the most recent Mortgage that was taken out on this home.
Original Mortgage
$185,200
Interest Rate
8.82%
Mortgage Type
Unknown
Create a Home Valuation Report for This Property
The Home Valuation Report is an in-depth analysis detailing your home's value as well as a comparison with similar homes in the area
Home Values in the Area
Average Home Value in this Area
Purchase History
| Date | Buyer | Sale Price | Title Company |
|---|---|---|---|
| Gorman Thomas | $233,000 | -- | |
| Larsen Carl W | $182,000 | -- | |
| Steel Gary | $195,000 | -- |
Source: Public Records
Mortgage History
| Date | Status | Borrower | Loan Amount |
|---|---|---|---|
| Open | Steel Gary | $145,000 | |
| Previous Owner | Steel Gary | $140,000 | |
| Previous Owner | Steel Gary | $185,200 |
Source: Public Records
Tax History
| Year | Tax Paid | Tax Assessment Tax Assessment Total Assessment is a certain percentage of the fair market value that is determined by local assessors to be the total taxable value of land and additions on the property. | Land | Improvement |
|---|---|---|---|---|
| 2025 | $8,943 | $222,460 | $106,050 | $116,410 |
| 2024 | $8,943 | $222,460 | $106,050 | $116,410 |
| 2023 | $8,943 | $222,460 | $106,050 | $116,410 |
| 2022 | $8,778 | $222,460 | $106,050 | $116,410 |
| 2021 | $8,780 | $222,460 | $106,050 | $116,410 |
| 2020 | $8,818 | $222,460 | $106,050 | $116,410 |
| 2019 | $8,004 | $200,760 | $89,250 | $111,510 |
| 2018 | $8,010 | $200,760 | $89,250 | $111,510 |
| 2017 | $8,024 | $200,760 | $89,250 | $111,510 |
| 2016 | $7,828 | $200,760 | $89,250 | $111,510 |
| 2015 | $7,424 | $200,760 | $89,250 | $111,510 |
| 2014 | $7,500 | $210,490 | $95,270 | $115,220 |
Source: Public Records
Map
Nearby Homes
- 120 Barton Dr
- 135 Wigwam Ln
- 25 Fairchild Rd
- 1414 Huntington Rd
- 670 Wigwam Ln
- 175 Post Oak Rd
- 260 Overland Dr
- 280 Goldbach Dr
- 170 Pumpkin Ground Rd
- 52 Circle Dr
- 165 Douglas St
- 130 Wainwright Place
- 185 Cutspring Rd
- 700 Huntington Rd
- 244 Rockland Ave
- 2322 Nichols Ave
- 15 Ferndale Place
- 5060 Main St
- 5695 Main St
- 183 Burbank Ave
Your Personal Tour Guide
Ask me questions while you tour the home.