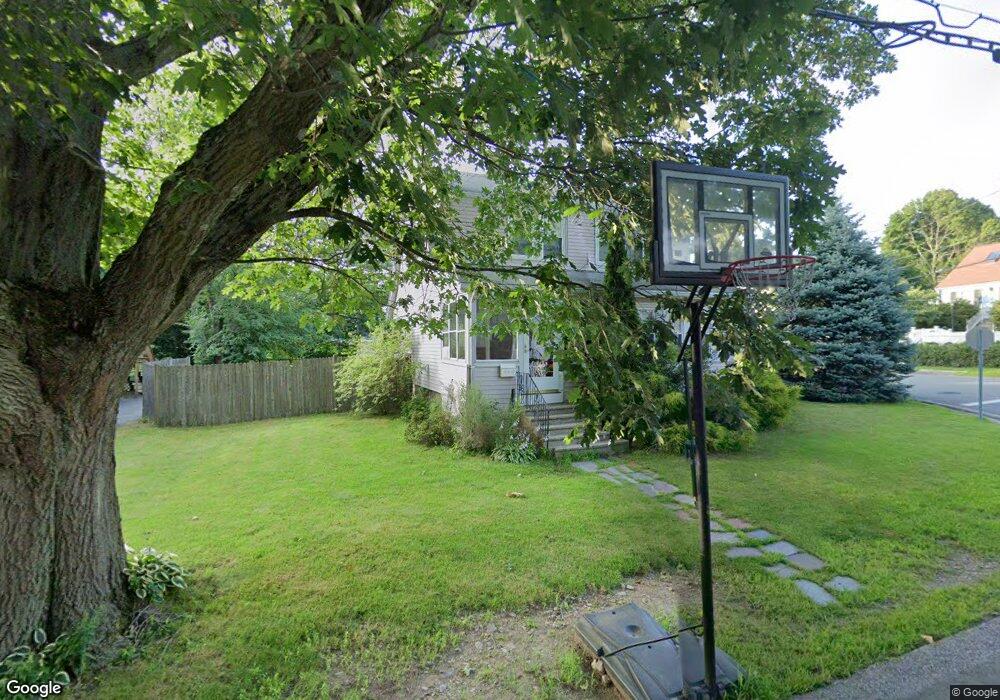
50 Wilkins Rd Braintree, MA 02184
East Braintree NeighborhoodEstimated Value: $605,000 - $653,000
3
Beds
1
Bath
1,439
Sq Ft
$437/Sq Ft
Est. Value
About This Home
This home is located at 50 Wilkins Rd, Braintree, MA 02184 and is currently estimated at $629,120, approximately $437 per square foot. 50 Wilkins Rd is a home located in Norfolk County with nearby schools including Braintree High School, Sacred Heart Elementary School, and Noble Academy.
Ownership History
Date
Name
Owned For
Owner Type
Purchase Details
Closed on
Apr 2, 2001
Sold by
Bac Pac Rt
Bought by
Macneil Mark and Macneil Patrice
Current Estimated Value
Home Financials for this Owner
Home Financials are based on the most recent Mortgage that was taken out on this home.
Original Mortgage
$200,000
Outstanding Balance
$73,398
Interest Rate
6.96%
Mortgage Type
Purchase Money Mortgage
Estimated Equity
$555,722
Purchase Details
Closed on
Nov 6, 1998
Sold by
Hatch Frances A
Bought by
Cohoon Tr Brian A
Create a Home Valuation Report for This Property
The Home Valuation Report is an in-depth analysis detailing your home's value as well as a comparison with similar homes in the area
Home Values in the Area
Average Home Value in this Area
Purchase History
| Date | Buyer | Sale Price | Title Company |
|---|---|---|---|
| Macneil Mark | $250,000 | -- | |
| Cohoon Tr Brian A | $82,500 | -- |
Source: Public Records
Mortgage History
| Date | Status | Borrower | Loan Amount |
|---|---|---|---|
| Open | Cohoon Tr Brian A | $200,000 | |
| Previous Owner | Cohoon Tr Brian A | $110,000 | |
| Closed | Cohoon Tr Brian A | $37,500 |
Source: Public Records
Tax History Compared to Growth
Tax History
| Year | Tax Paid | Tax Assessment Tax Assessment Total Assessment is a certain percentage of the fair market value that is determined by local assessors to be the total taxable value of land and additions on the property. | Land | Improvement |
|---|---|---|---|---|
| 2025 | $5,930 | $594,200 | $366,500 | $227,700 |
| 2024 | $5,393 | $568,900 | $343,600 | $225,300 |
| 2023 | $5,026 | $515,000 | $302,400 | $212,600 |
| 2022 | $4,851 | $487,500 | $274,900 | $212,600 |
| 2021 | $4,294 | $431,600 | $231,800 | $199,800 |
| 2020 | $4,168 | $422,700 | $231,800 | $190,900 |
| 2019 | $4,148 | $411,100 | $231,800 | $179,300 |
| 2018 | $3,934 | $373,200 | $201,600 | $171,600 |
| 2017 | $3,702 | $344,700 | $183,300 | $161,400 |
| 2016 | $3,506 | $319,300 | $164,900 | $154,400 |
| 2015 | $3,432 | $310,000 | $161,300 | $148,700 |
| 2014 | $3,262 | $285,600 | $148,400 | $137,200 |
Source: Public Records
Map
Nearby Homes
- 74 Magnolia St
- 1 Pantano St
- 159 Hobart St
- 141 Hobart St
- 312 Shaw St
- 10 Skyline Dr Unit 5
- 9 Hillside Ave
- 30 Skyline Dr Unit 6
- 67 Somerville Ave
- 125 Allen St Unit A
- 25 W Howard St Unit D2
- 15 Bower Rd Unit B5
- 15 Bower Rd Unit B2
- 48 Conrad St
- 51 Faxon St
- 106 Home Park Rd
- 141 Commercial St Unit 9
- 41 Lantern Ln
- 37 Lantern Ln
- 86 Alton Rd