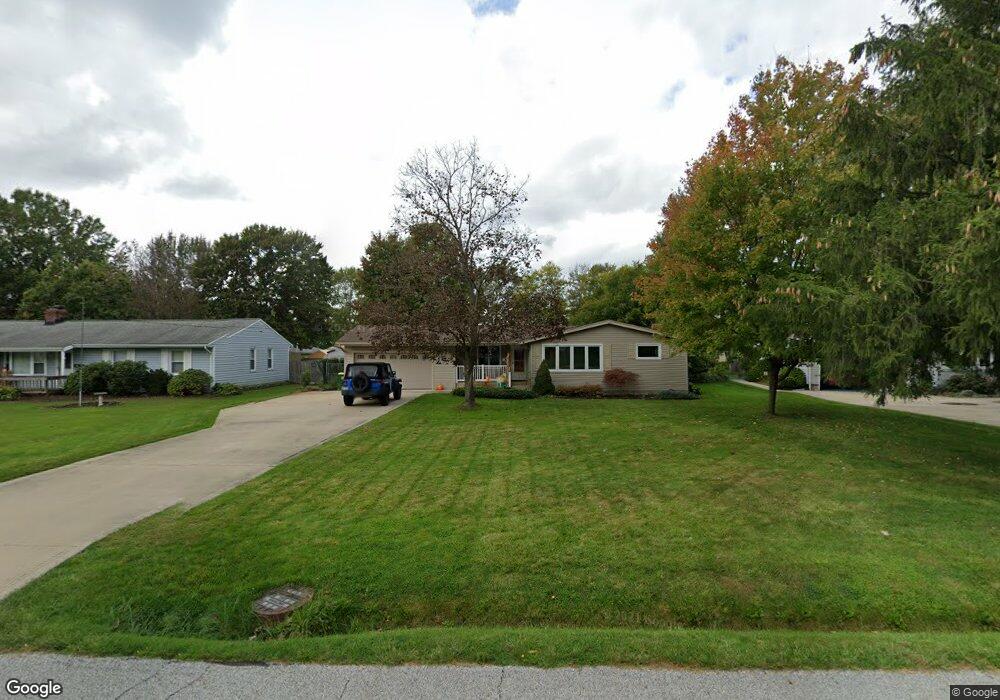
50 Wilmington Dr Painesville, OH 44077
Estimated Value: $202,024 - $237,000
3
Beds
2
Baths
1,112
Sq Ft
$197/Sq Ft
Est. Value
About This Home
This home is located at 50 Wilmington Dr, Painesville, OH 44077 and is currently estimated at $219,506, approximately $197 per square foot. 50 Wilmington Dr is a home located in Lake County with nearby schools including Henry F. Lamuth Middle School, Riverside Junior/Senior High School, and Hershey Montessori Elementary School.
Ownership History
Date
Name
Owned For
Owner Type
Purchase Details
Closed on
May 25, 2021
Sold by
Tobias Thomas P and Tobias Silvia
Bought by
Tobias Thomas P and Tobias Megan N
Current Estimated Value
Home Financials for this Owner
Home Financials are based on the most recent Mortgage that was taken out on this home.
Original Mortgage
$143,100
Outstanding Balance
$129,482
Interest Rate
3%
Mortgage Type
New Conventional
Estimated Equity
$90,024
Purchase Details
Closed on
May 15, 2021
Sold by
Tobias Thomas P
Bought by
Tobbias Thomas P and Brennan Megan N
Home Financials for this Owner
Home Financials are based on the most recent Mortgage that was taken out on this home.
Original Mortgage
$143,100
Outstanding Balance
$129,482
Interest Rate
3%
Mortgage Type
New Conventional
Estimated Equity
$90,024
Purchase Details
Closed on
Feb 25, 2016
Sold by
Barstow L Tobias
Bought by
Thomas P Tobias
Purchase Details
Closed on
Aug 12, 1985
Bought by
Barstow L Tobias
Create a Home Valuation Report for This Property
The Home Valuation Report is an in-depth analysis detailing your home's value as well as a comparison with similar homes in the area
Home Values in the Area
Average Home Value in this Area
Purchase History
| Date | Buyer | Sale Price | Title Company |
|---|---|---|---|
| Tobias Thomas P | -- | None Listed On Document | |
| Tobbias Thomas P | $159,000 | None Available | |
| Thomas P Tobias | -- | -- | |
| Barstow L Tobias | -- | -- |
Source: Public Records
Mortgage History
| Date | Status | Borrower | Loan Amount |
|---|---|---|---|
| Open | Tobias Thomas P | $143,100 | |
| Closed | Tobbias Thomas P | $143,100 |
Source: Public Records
Tax History Compared to Growth
Tax History
| Year | Tax Paid | Tax Assessment Tax Assessment Total Assessment is a certain percentage of the fair market value that is determined by local assessors to be the total taxable value of land and additions on the property. | Land | Improvement |
|---|---|---|---|---|
| 2024 | -- | $53,250 | $19,730 | $33,520 |
| 2023 | $4,852 | $44,530 | $17,080 | $27,450 |
| 2022 | $2,724 | $44,530 | $17,080 | $27,450 |
| 2021 | $2,788 | $45,990 | $17,080 | $28,910 |
| 2020 | $2,533 | $36,800 | $13,670 | $23,130 |
| 2019 | $2,552 | $36,800 | $13,670 | $23,130 |
| 2018 | $2,560 | $28,380 | $10,060 | $18,320 |
| 2017 | $2,047 | $28,380 | $10,060 | $18,320 |
| 2016 | $1,243 | $28,380 | $10,060 | $18,320 |
| 2015 | $1,124 | $28,380 | $10,060 | $18,320 |
| 2014 | $1,142 | $28,380 | $10,060 | $18,320 |
| 2013 | $1,116 | $28,380 | $10,060 | $18,320 |
Source: Public Records
Map
Nearby Homes
- 1651 Mentor Ave Unit 2008
- 1651 Mentor Ave Unit 2804
- 1651 Mentor Ave Unit 1706
- 336 Fairgrounds Rd
- 180 Clairmont Dr
- 113 Palm Ct
- 6624 Belvoir Ct
- 81 Fairfield Rd
- 0 W Jackson St Unit 5103770
- 0 W Jackson St Unit 5156332
- 1703 W Jackson St
- 6677 Stratford Rd
- 224 Larchwood Dr
- 339 Barrington Ridge Rd
- 6533 Coleridge Rd
- 1714 W Jackson St
- 146 Garfield Dr
- V/L Johnnycake Ridge Rd
- 1936 Mentor Ave
- 2051 Kingsborough Dr
- 58 Wilmington Dr
- 66 Wilmington Dr
- 123 Normandy Dr
- 131 Normandy Dr
- 36 Wilmington Dr
- 115 Normandy Dr
- 139 Normandy Dr
- 55 Wilmington Dr
- 37 Wilmington Dr
- 76 Wilmington Dr
- 63 Wilmington Dr
- 28 Wilmington Dr
- 33 Wilmington Dr
- 149 Normandy Dr
- 71 Wilmington Dr
- 99 Normandy Dr
- 23 Wilmington Dr
- 20 Wilmington Dr
- 77 Wilmington Dr
- 171 Normandy Dr