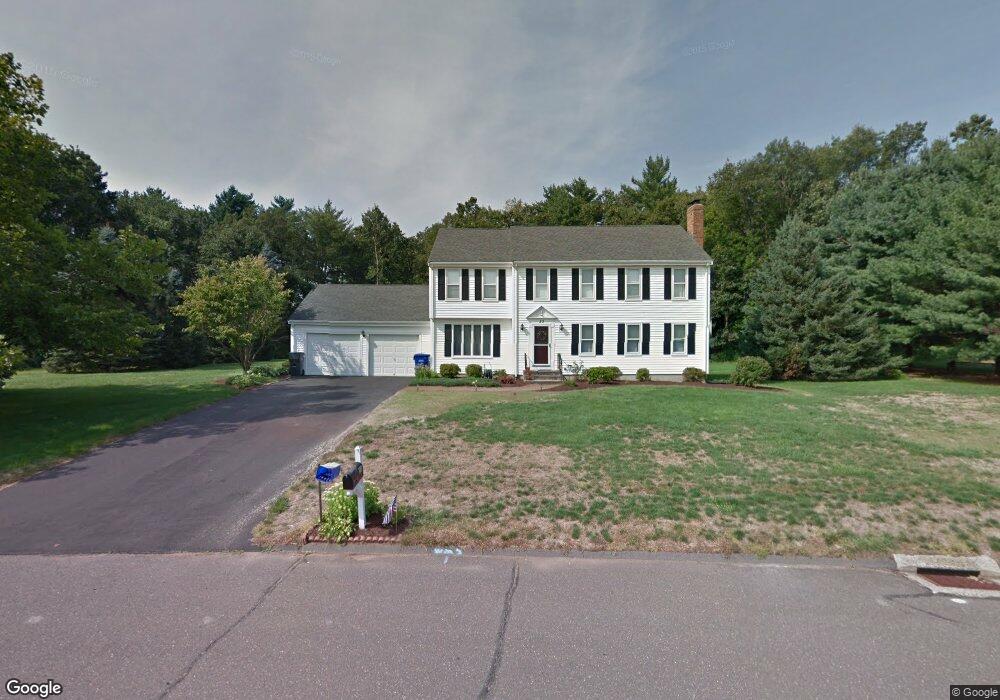
50 Windmill Rd Ellington, CT 06029
Estimated Value: $602,000 - $681,000
5
Beds
3
Baths
2,534
Sq Ft
$250/Sq Ft
Est. Value
About This Home
This home is located at 50 Windmill Rd, Ellington, CT 06029 and is currently estimated at $634,241, approximately $250 per square foot. 50 Windmill Rd is a home located in Tolland County with nearby schools including Ellington High School.
Ownership History
Date
Name
Owned For
Owner Type
Purchase Details
Closed on
Apr 13, 2016
Sold by
Clair Christopher J and Clair Patricia K
Bought by
Redekas David and Redekas Linda
Current Estimated Value
Home Financials for this Owner
Home Financials are based on the most recent Mortgage that was taken out on this home.
Original Mortgage
$320,051
Outstanding Balance
$253,927
Interest Rate
3.64%
Mortgage Type
Purchase Money Mortgage
Estimated Equity
$380,314
Purchase Details
Closed on
Nov 3, 1986
Bought by
Clair Christopher J and Clair Patricia K
Create a Home Valuation Report for This Property
The Home Valuation Report is an in-depth analysis detailing your home's value as well as a comparison with similar homes in the area
Home Values in the Area
Average Home Value in this Area
Purchase History
| Date | Buyer | Sale Price | Title Company |
|---|---|---|---|
| Redekas David | $351,500 | -- | |
| Clair Christopher J | -- | -- |
Source: Public Records
Mortgage History
| Date | Status | Borrower | Loan Amount |
|---|---|---|---|
| Open | Redekas David | $320,051 | |
| Previous Owner | Clair Christopher J | $57,000 |
Source: Public Records
Tax History
| Year | Tax Paid | Tax Assessment Tax Assessment Total Assessment is a certain percentage of the fair market value that is determined by local assessors to be the total taxable value of land and additions on the property. | Land | Improvement |
|---|---|---|---|---|
| 2025 | $8,944 | $241,070 | $62,970 | $178,100 |
| 2024 | $8,679 | $241,070 | $62,970 | $178,100 |
| 2023 | $8,269 | $241,070 | $62,970 | $178,100 |
| 2022 | $7,835 | $241,070 | $62,970 | $178,100 |
| 2021 | $7,618 | $241,070 | $62,970 | $178,100 |
| 2020 | $7,900 | $242,340 | $62,810 | $179,530 |
| 2019 | $7,900 | $242,340 | $62,810 | $179,530 |
| 2016 | $6,874 | $225,370 | $62,810 | $162,560 |
| 2015 | $6,995 | $229,360 | $62,810 | $166,550 |
| 2014 | $6,583 | $229,360 | $62,810 | $166,550 |
Source: Public Records
Map
Nearby Homes
- 37 Ellsworth Ln
- 254 Jobs Hill Rd
- 89 Maple St
- 58 Maple St
- 42 Crane Rd
- 0 Crane Rd Unit 24151873
- 437 Somers Rd
- 160 East Rd
- 164 East Rd
- 0 Porter Rd
- 183 Chamberlain Rd
- 41 Cider Mill Rd
- 4 Jessie Ln
- 11 Acorn Dr Unit 11
- 222 Mountain Rd
- 77 Thrall Rd
- 56 Highland Ave
- 6 Setting Sun Trail
- 2 Setting Sun Trail
- 178 Crystal Lake Rd