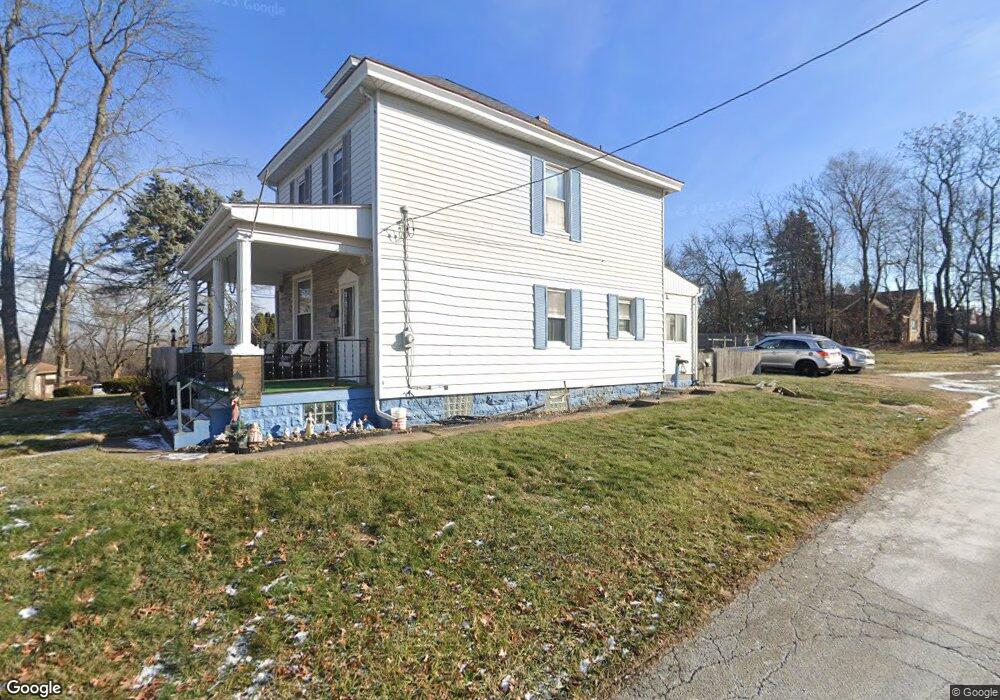
500 3rd St North Versailles, PA 15137
Estimated Value: $137,000 - $159,000
3
Beds
2
Baths
1,320
Sq Ft
$113/Sq Ft
Est. Value
About This Home
This home is located at 500 3rd St, North Versailles, PA 15137 and is currently estimated at $149,232, approximately $113 per square foot. 500 3rd St is a home located in Allegheny County with nearby schools including Logan Elementary School, Propel Cs-East, and Praise Christian Academy.
Ownership History
Date
Name
Owned For
Owner Type
Purchase Details
Closed on
Jul 27, 2022
Sold by
Bongyor Joseph G and Bongyor Joseph G
Bought by
Bongyor Joseph G and Bongyor Melissa M
Current Estimated Value
Purchase Details
Closed on
Jul 19, 2022
Sold by
Bongyor Joseph G
Bought by
Bongyor Joseph G and Bongyor Melissa M
Purchase Details
Closed on
Jul 17, 2008
Sold by
Boyd Ruth A
Bought by
Bongyor Joseph G
Home Financials for this Owner
Home Financials are based on the most recent Mortgage that was taken out on this home.
Original Mortgage
$74,399
Interest Rate
6.35%
Mortgage Type
FHA
Create a Home Valuation Report for This Property
The Home Valuation Report is an in-depth analysis detailing your home's value as well as a comparison with similar homes in the area
Home Values in the Area
Average Home Value in this Area
Purchase History
| Date | Buyer | Sale Price | Title Company |
|---|---|---|---|
| Bongyor Joseph G | -- | -- | |
| Bongyor Joseph G | -- | -- | |
| Bongyor Joseph G | $75,000 | -- |
Source: Public Records
Mortgage History
| Date | Status | Borrower | Loan Amount |
|---|---|---|---|
| Previous Owner | Bongyor Joseph G | $74,399 |
Source: Public Records
Tax History Compared to Growth
Tax History
| Year | Tax Paid | Tax Assessment Tax Assessment Total Assessment is a certain percentage of the fair market value that is determined by local assessors to be the total taxable value of land and additions on the property. | Land | Improvement |
|---|---|---|---|---|
| 2025 | $2,430 | $61,600 | $18,400 | $43,200 |
| 2024 | $2,430 | $61,600 | $18,400 | $43,200 |
| 2023 | $2,430 | $61,600 | $18,400 | $43,200 |
| 2022 | $2,430 | $61,600 | $18,400 | $43,200 |
| 2021 | $2,430 | $61,600 | $18,400 | $43,200 |
| 2020 | $2,430 | $61,600 | $18,400 | $43,200 |
| 2019 | $2,430 | $61,600 | $18,400 | $43,200 |
| 2018 | $291 | $61,600 | $18,400 | $43,200 |
| 2017 | $2,430 | $61,600 | $18,400 | $43,200 |
| 2016 | $291 | $61,600 | $18,400 | $43,200 |
| 2015 | $291 | $61,600 | $18,400 | $43,200 |
| 2014 | $2,465 | $61,600 | $18,400 | $43,200 |
Source: Public Records
Map
Nearby Homes