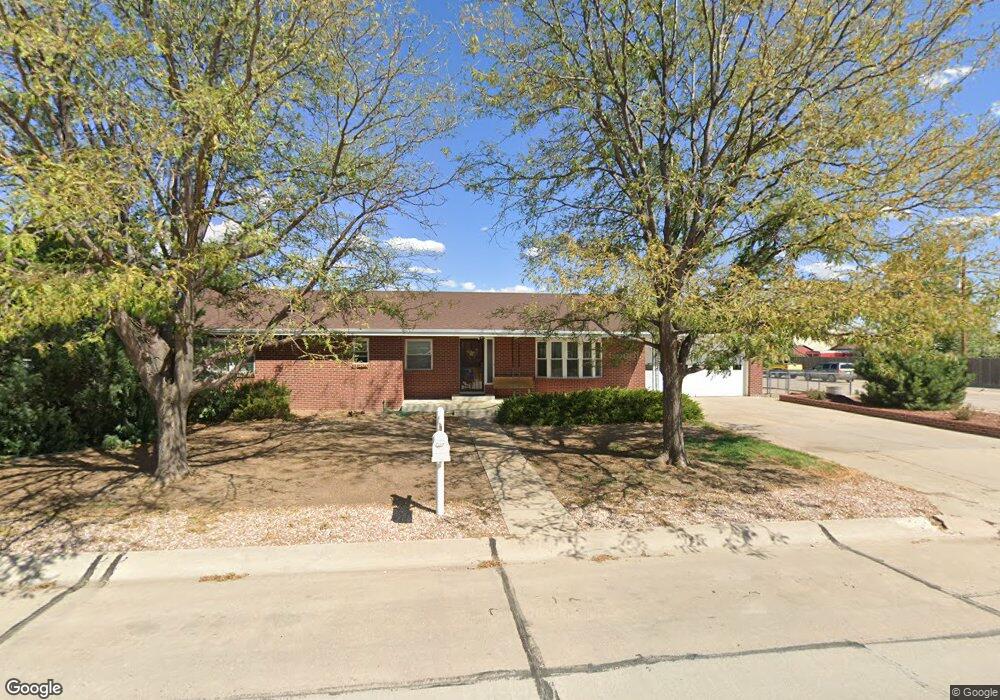
500 6th St Bennett, CO 80102
Estimated Value: $439,874 - $478,000
3
Beds
3
Baths
1,875
Sq Ft
$245/Sq Ft
Est. Value
About This Home
This home is located at 500 6th St, Bennett, CO 80102 and is currently estimated at $459,219, approximately $244 per square foot. 500 6th St is a home located in Adams County with nearby schools including Bennett Elementary School, Bennett Middle School, and Bennett High School.
Ownership History
Date
Name
Owned For
Owner Type
Purchase Details
Closed on
Aug 24, 2020
Sold by
Webb Phyllis E
Bought by
Jordan Amy
Current Estimated Value
Home Financials for this Owner
Home Financials are based on the most recent Mortgage that was taken out on this home.
Original Mortgage
$329,800
Outstanding Balance
$290,574
Interest Rate
3%
Mortgage Type
New Conventional
Estimated Equity
$168,645
Purchase Details
Closed on
Jan 4, 2007
Sold by
Piland Lowell D
Bought by
Webb Phyllis E
Home Financials for this Owner
Home Financials are based on the most recent Mortgage that was taken out on this home.
Original Mortgage
$150,000
Interest Rate
6.2%
Mortgage Type
Unknown
Purchase Details
Closed on
Oct 30, 2006
Sold by
Piland & Co
Bought by
Piland Lowell D
Home Financials for this Owner
Home Financials are based on the most recent Mortgage that was taken out on this home.
Original Mortgage
$172,500
Interest Rate
7.25%
Mortgage Type
Construction
Create a Home Valuation Report for This Property
The Home Valuation Report is an in-depth analysis detailing your home's value as well as a comparison with similar homes in the area
Purchase History
| Date | Buyer | Sale Price | Title Company |
|---|---|---|---|
| Jordan Amy | $340,000 | New Title Company Name | |
| Webb Phyllis E | $200,000 | Utc Colorado | |
| Piland Lowell D | $172,500 | Chicago Title Co |
Source: Public Records
Mortgage History
| Date | Status | Borrower | Loan Amount |
|---|---|---|---|
| Open | Jordan Amy | $329,800 | |
| Previous Owner | Webb Phyllis E | $150,000 | |
| Previous Owner | Piland Lowell D | $172,500 |
Source: Public Records
Tax History
| Year | Tax Paid | Tax Assessment Tax Assessment Total Assessment is a certain percentage of the fair market value that is determined by local assessors to be the total taxable value of land and additions on the property. | Land | Improvement |
|---|---|---|---|---|
| 2025 | $2,463 | $30,600 | $4,760 | $25,840 |
| 2024 | $2,463 | $28,130 | $4,380 | $23,750 |
| 2023 | $2,478 | $32,680 | $4,740 | $27,940 |
| 2022 | $2,153 | $24,990 | $3,680 | $21,310 |
| 2021 | $2,199 | $24,990 | $3,680 | $21,310 |
| 2020 | $1,705 | $20,240 | $3,790 | $16,450 |
| 2019 | $1,751 | $20,240 | $3,790 | $16,450 |
| 2018 | $1,713 | $18,000 | $4,320 | $13,680 |
| 2017 | $1,728 | $18,000 | $4,320 | $13,680 |
| 2016 | $1,475 | $15,920 | $1,830 | $14,090 |
| 2015 | $1,468 | $15,920 | $1,830 | $14,090 |
| 2014 | -- | $13,320 | $1,910 | $11,410 |
Source: Public Records
Map
Nearby Homes
- 610 6th St
- 574 4th St
- 0 Colorado 79
- 575 2nd St
- 740 Cottonwood Ave
- 625 Aspen Ave
- 231 Dahlia St
- 216 Ash St
- 48165 Shetland Dr
- 48190 Shetland Dr
- 48175 Shetland Dr
- 48215 Shetland Dr
- 48250 Shetland Dr
- 48240 Shetland Dr
- 48285 Shetland Dr
- 48210 Shetland Dr
- 48295 Shetland Dr
- 48245 Shetland Dr
- 48195 Shetland Dr
- 48270 Shetland Dr
Your Personal Tour Guide
Ask me questions while you tour the home.