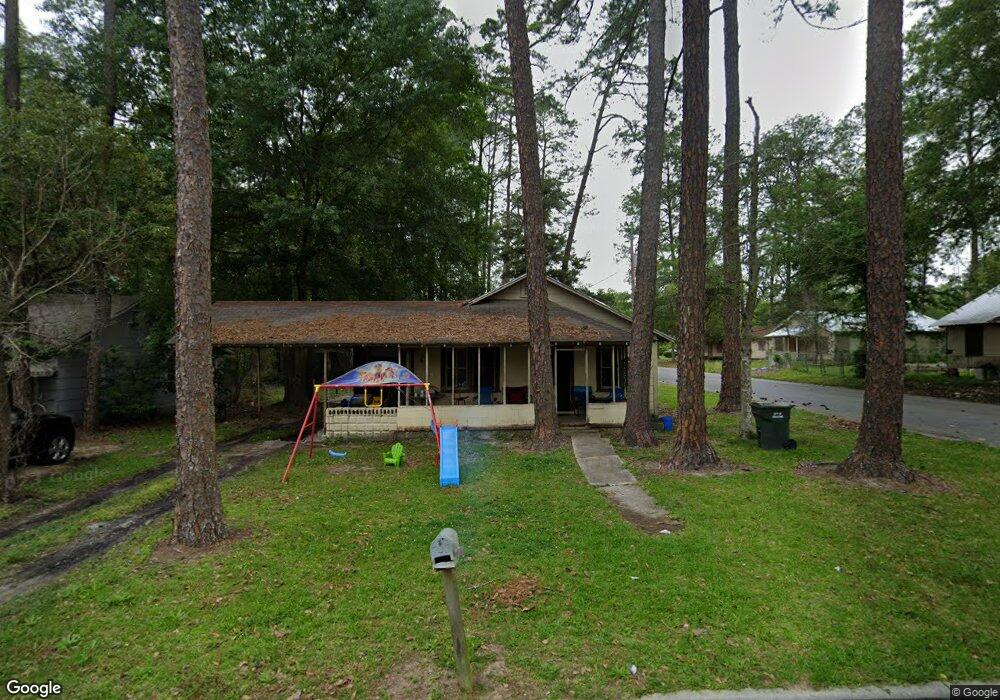
500 7th St SW Moultrie, GA 31768
Estimated Value: $60,636 - $89,000
--
Bed
1
Bath
988
Sq Ft
$77/Sq Ft
Est. Value
About This Home
This home is located at 500 7th St SW, Moultrie, GA 31768 and is currently estimated at $75,909, approximately $76 per square foot. 500 7th St SW is a home located in Colquitt County with nearby schools including Stringfellow Elementary School, Willie J. Williams Middle School, and C.A. Gray Junior High School.
Ownership History
Date
Name
Owned For
Owner Type
Purchase Details
Closed on
Jan 28, 2008
Sold by
Mangum Sam W
Bought by
Folsom Michael W and Folson Judy D
Current Estimated Value
Home Financials for this Owner
Home Financials are based on the most recent Mortgage that was taken out on this home.
Original Mortgage
$110,000
Interest Rate
6.17%
Mortgage Type
New Conventional
Purchase Details
Closed on
Aug 14, 2006
Sold by
Mangum Sam W
Bought by
Folsom Michael W and Folsom Judy D
Purchase Details
Closed on
Aug 30, 2002
Sold by
Castleberry Jason Robert
Bought by
Folsom Mark
Purchase Details
Closed on
Jan 4, 2002
Sold by
Mangum Sam
Bought by
Castleberry Jason Robert
Purchase Details
Closed on
Oct 21, 1997
Bought by
Mangum Sam
Purchase Details
Closed on
May 13, 1996
Bought by
Crosby Arlene
Purchase Details
Closed on
Apr 10, 1991
Bought by
Ellison Anne Lillian
Create a Home Valuation Report for This Property
The Home Valuation Report is an in-depth analysis detailing your home's value as well as a comparison with similar homes in the area
Home Values in the Area
Average Home Value in this Area
Purchase History
| Date | Buyer | Sale Price | Title Company |
|---|---|---|---|
| Folsom Michael W | -- | -- | |
| Folsom Michael W | $72,000 | -- | |
| Folsom Mark | -- | -- | |
| Castleberry Jason Robert | $51,000 | -- | |
| Mangum Sam | $27,000 | -- | |
| Crosby Arlene | $22,500 | -- | |
| Ellison Anne Lillian | $21,900 | -- |
Source: Public Records
Mortgage History
| Date | Status | Borrower | Loan Amount |
|---|---|---|---|
| Closed | Folsom Michael W | $110,000 |
Source: Public Records
Tax History Compared to Growth
Tax History
| Year | Tax Paid | Tax Assessment Tax Assessment Total Assessment is a certain percentage of the fair market value that is determined by local assessors to be the total taxable value of land and additions on the property. | Land | Improvement |
|---|---|---|---|---|
| 2024 | $321 | $11,835 | $684 | $11,151 |
| 2023 | $357 | $8,748 | $684 | $8,064 |
| 2022 | $283 | $8,466 | $684 | $7,782 |
| 2021 | $143 | $4,209 | $684 | $3,525 |
| 2020 | $145 | $4,209 | $684 | $3,525 |
| 2019 | $163 | $4,209 | $684 | $3,525 |
| 2018 | $168 | $4,209 | $684 | $3,525 |
| 2017 | $162 | $4,209 | $684 | $3,525 |
| 2016 | $168 | $4,209 | $684 | $3,525 |
| 2015 | $169 | $4,209 | $684 | $3,525 |
| 2014 | $173 | $4,209 | $684 | $3,525 |
| 2013 | -- | $4,208 | $683 | $3,525 |
Source: Public Records
Map
Nearby Homes