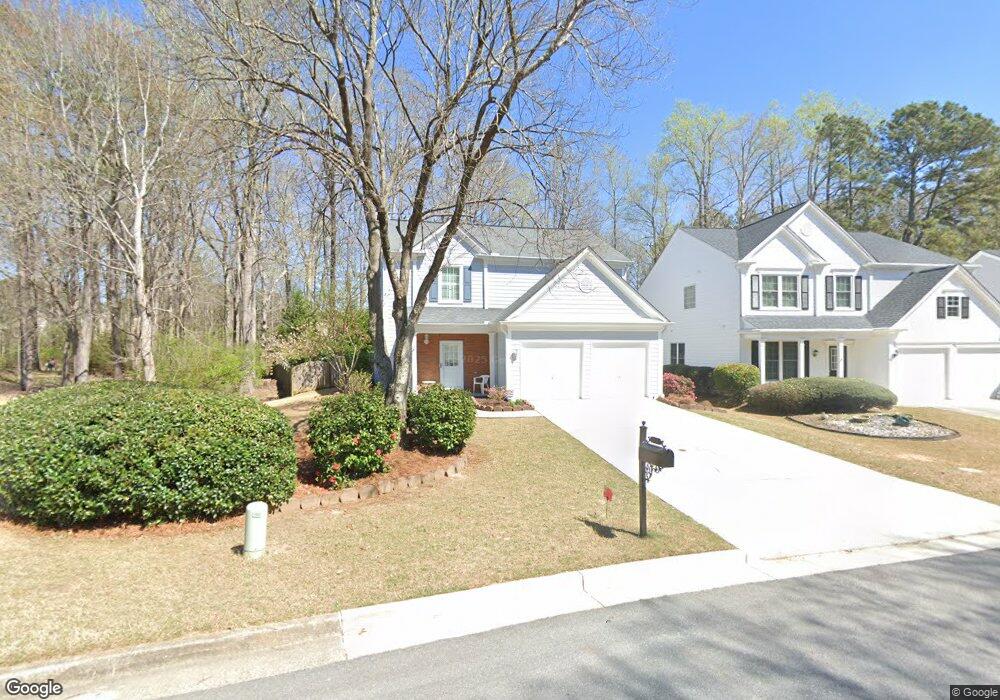
500 Arncliffe Ct Unit 1 Alpharetta, GA 30005
Wellington NeighborhoodEstimated Value: $570,000 - $595,773
3
Beds
3
Baths
2,256
Sq Ft
$257/Sq Ft
Est. Value
About This Home
This home is located at 500 Arncliffe Ct Unit 1, Alpharetta, GA 30005 and is currently estimated at $580,443, approximately $257 per square foot. 500 Arncliffe Ct Unit 1 is a home located in Fulton County with nearby schools including Taylor Road Middle School, Chattahoochee High School, and Cresco Montessori School - Johns Creek Campus.
Ownership History
Date
Name
Owned For
Owner Type
Purchase Details
Closed on
Jul 6, 2021
Sold by
Hull Jack B
Bought by
Jack B Hull Rev Tr
Current Estimated Value
Purchase Details
Closed on
Jan 10, 2006
Sold by
Hull Jack B
Bought by
Hull Jack B and Hull Todd J
Purchase Details
Closed on
Sep 15, 2003
Sold by
Hull Jack B
Bought by
Hull Jack B
Purchase Details
Closed on
Jan 14, 1999
Sold by
Heidt Brittnany L and Heidt Barry M
Bought by
Hull Jack B
Home Financials for this Owner
Home Financials are based on the most recent Mortgage that was taken out on this home.
Original Mortgage
$151,000
Interest Rate
6.71%
Mortgage Type
New Conventional
Purchase Details
Closed on
May 30, 1997
Sold by
Pulte Home Corp
Bought by
Heidt Brittany L and Heidt Barry
Create a Home Valuation Report for This Property
The Home Valuation Report is an in-depth analysis detailing your home's value as well as a comparison with similar homes in the area
Home Values in the Area
Average Home Value in this Area
Purchase History
| Date | Buyer | Sale Price | Title Company |
|---|---|---|---|
| Jack B Hull Rev Tr | -- | -- | |
| Hull Jack B | -- | -- | |
| Hull Jack B | -- | -- | |
| Hull Jack B | $151,000 | -- | |
| Heidt Brittany L | $146,500 | -- |
Source: Public Records
Mortgage History
| Date | Status | Borrower | Loan Amount |
|---|---|---|---|
| Previous Owner | Hull Jack B | $151,000 | |
| Closed | Heidt Brittany L | -- |
Source: Public Records
Tax History Compared to Growth
Tax History
| Year | Tax Paid | Tax Assessment Tax Assessment Total Assessment is a certain percentage of the fair market value that is determined by local assessors to be the total taxable value of land and additions on the property. | Land | Improvement |
|---|---|---|---|---|
| 2025 | $28 | $239,600 | $57,200 | $182,400 |
| 2023 | $5,512 | $195,280 | $39,480 | $155,800 |
| 2022 | $95 | $150,640 | $30,400 | $120,240 |
| 2021 | $50 | $131,200 | $26,840 | $104,360 |
| 2020 | $224 | $139,880 | $28,520 | $111,360 |
| 2019 | $0 | $137,440 | $28,040 | $109,400 |
| 2018 | $1,819 | $109,120 | $19,880 | $89,240 |
| 2017 | $1,642 | $95,960 | $17,920 | $78,040 |
| 2016 | $1,621 | $97,680 | $17,920 | $79,760 |
| 2015 | $1,526 | $92,480 | $17,920 | $74,560 |
| 2014 | $1,248 | $77,440 | $18,240 | $59,200 |
Source: Public Records
Map
Nearby Homes
- 640 Arncliffe Ct Unit 1
- 775 Ellsborough Ct
- 11420 Crossington Rd
- 230 Sessingham Ln
- 5785 Oxborough Way Unit 1
- 130 Wyndlam Ct
- 11260 Donnington Dr
- 5690 Abbotts Bridge Rd
- 11615 Windbrooke Way
- 5680 Abbotts Bridge Rd
- 11205 Abbotts Station Dr
- 5610 N Hillbrooke Trace
- 1660 Gladewood Dr
- 5575 Ashwind Trace
- 11235 Surrey Park Trail
- 11800 Carriage Park Ln
- 11915 Carriage Park Ln
- 510 Arncliffe Ct Unit 1
- 520 Arncliffe Ct Unit 1
- 530 Arncliffe Ct
- 515 Arncliffe Ct Unit 1
- 11625 Bentham Ct
- 11590 Bentham Ct
- 11590 Bentham Ct
- 540 Arncliffe Ct Unit 1
- 11600 Bentham Ct
- 11615 Bentham Ct Unit 2
- 11610 Bentham Ct Unit 1
- 550 Arncliffe Ct
- 525 Arncliffe Ct
- 0 Bentham Ct Unit 8559464
- 0 Bentham Ct Unit 8465247
- 0 Bentham Ct Unit 8223273
- 0 Bentham Ct Unit 8159665
- 0 Bentham Ct Unit 8156991
- 0 Bentham Ct Unit 8087089
- 0 Bentham Ct Unit 8666880