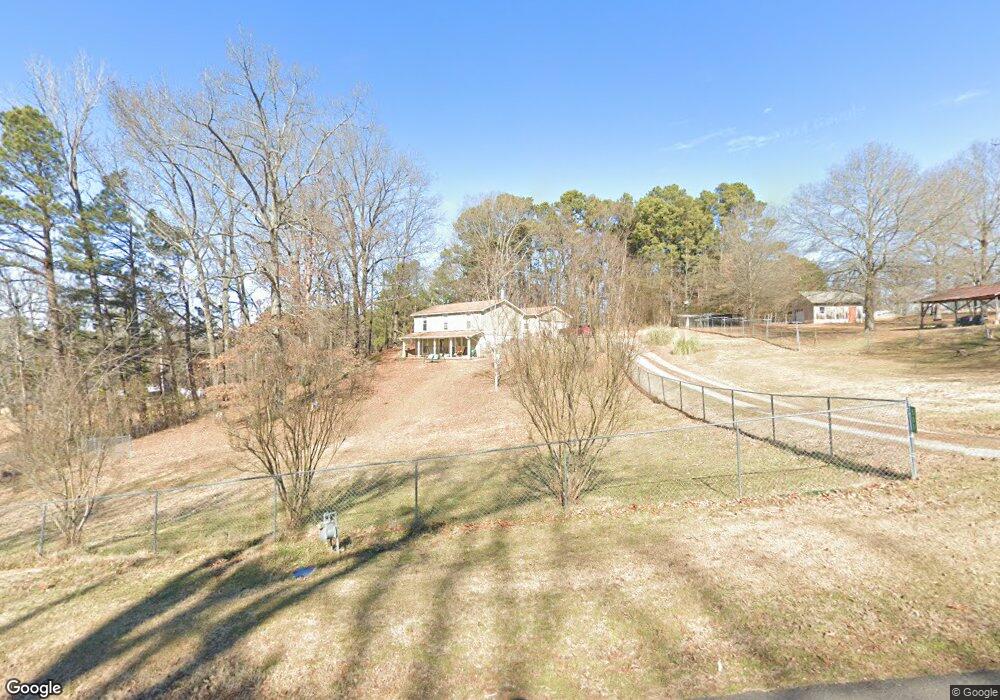
500 Berwick Benton, AR 72019
Estimated Value: $206,313 - $247,000
Studio
3
Baths
1,320
Sq Ft
$169/Sq Ft
Est. Value
About This Home
This home is located at 500 Berwick, Benton, AR 72019 and is currently estimated at $222,578, approximately $168 per square foot. 500 Berwick is a home located in Saline County with nearby schools including Benton Middle School, Caldwell Elementary School, and Benton Junior High School.
Ownership History
Date
Name
Owned For
Owner Type
Purchase Details
Closed on
Dec 19, 2011
Sold by
Elmore Jason E and Elmore Jaclyn
Bought by
Elmore Jason E and Elmore Jaclyn
Current Estimated Value
Home Financials for this Owner
Home Financials are based on the most recent Mortgage that was taken out on this home.
Original Mortgage
$114,000
Outstanding Balance
$45,853
Interest Rate
4.03%
Mortgage Type
New Conventional
Estimated Equity
$176,725
Purchase Details
Closed on
Nov 17, 2006
Sold by
Farmer Richard E and Farmer Marsha K
Bought by
Elmore Jason E
Home Financials for this Owner
Home Financials are based on the most recent Mortgage that was taken out on this home.
Original Mortgage
$121,600
Interest Rate
6.37%
Mortgage Type
New Conventional
Purchase Details
Closed on
Jan 18, 1994
Bought by
Farmer
Create a Home Valuation Report for This Property
The Home Valuation Report is an in-depth analysis detailing your home's value as well as a comparison with similar homes in the area
Home Values in the Area
Average Home Value in this Area
Purchase History
| Date | Buyer | Sale Price | Title Company |
|---|---|---|---|
| Elmore Jason E | -- | None Available | |
| Elmore Jason E | -- | -- | |
| Farmer | $90,000 | -- |
Source: Public Records
Mortgage History
| Date | Status | Borrower | Loan Amount |
|---|---|---|---|
| Open | Elmore Jason E | $114,000 | |
| Previous Owner | Elmore Jason E | $121,600 |
Source: Public Records
Tax History
| Year | Tax Paid | Tax Assessment Tax Assessment Total Assessment is a certain percentage of the fair market value that is determined by local assessors to be the total taxable value of land and additions on the property. | Land | Improvement |
|---|---|---|---|---|
| 2025 | $1,712 | $38,576 | $7,620 | $30,956 |
| 2024 | $1,753 | $38,576 | $7,620 | $30,956 |
| 2023 | $1,213 | $38,576 | $7,620 | $30,956 |
| 2022 | $1,189 | $38,576 | $7,620 | $30,956 |
| 2021 | $1,115 | $26,890 | $3,810 | $23,080 |
| 2020 | $1,115 | $26,890 | $3,810 | $23,080 |
| 2019 | $1,115 | $26,890 | $3,810 | $23,080 |
| 2018 | $1,137 | $26,890 | $3,810 | $23,080 |
| 2017 | $1,137 | $26,890 | $3,810 | $23,080 |
| 2016 | $1,484 | $26,170 | $3,810 | $22,360 |
| 2015 | $1,108 | $26,170 | $3,810 | $22,360 |
| 2014 | $1,118 | $26,170 | $3,810 | $22,360 |
Source: Public Records
Map
Nearby Homes
Your Personal Tour Guide
Ask me questions while you tour the home.