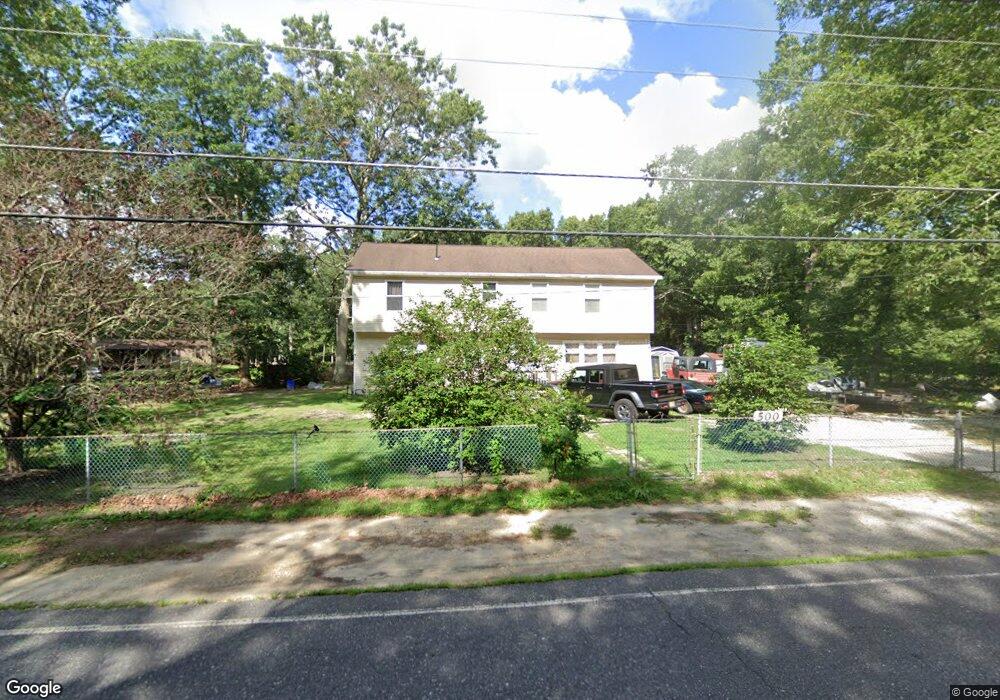
500 Columbia Rd Egg Harbor City, NJ 08215
Estimated Value: $283,613 - $393,000
--
Bed
--
Bath
2,400
Sq Ft
$145/Sq Ft
Est. Value
About This Home
This home is located at 500 Columbia Rd, Egg Harbor City, NJ 08215 and is currently estimated at $348,538, approximately $145 per square foot. 500 Columbia Rd is a home located in Atlantic County with nearby schools including Mullica Township Primary School, Mullica Township Elementary & Middle School, and Cedar Creek High School.
Ownership History
Date
Name
Owned For
Owner Type
Purchase Details
Closed on
Oct 23, 2002
Sold by
Dangler Jamie A and Bloss Patrick D
Bought by
Dangler Shawn and Dangler Jamie A
Current Estimated Value
Home Financials for this Owner
Home Financials are based on the most recent Mortgage that was taken out on this home.
Original Mortgage
$102,870
Outstanding Balance
$42,907
Interest Rate
6.09%
Mortgage Type
FHA
Estimated Equity
$305,631
Purchase Details
Closed on
Aug 30, 1999
Sold by
Scaffidi Hart Carol and Hart Jeffrey L
Bought by
Ditzel Jamie A and Bloss Patrick D
Home Financials for this Owner
Home Financials are based on the most recent Mortgage that was taken out on this home.
Original Mortgage
$99,949
Interest Rate
7.76%
Mortgage Type
FHA
Purchase Details
Closed on
Jan 12, 1989
Sold by
Scaffidi Carol B
Bought by
Scaffidi Carol
Create a Home Valuation Report for This Property
The Home Valuation Report is an in-depth analysis detailing your home's value as well as a comparison with similar homes in the area
Home Values in the Area
Average Home Value in this Area
Purchase History
| Date | Buyer | Sale Price | Title Company |
|---|---|---|---|
| Dangler Shawn | -- | -- | |
| Ditzel Jamie A | $100,000 | Executive Title & Abstract I | |
| Scaffidi Carol | -- | -- |
Source: Public Records
Mortgage History
| Date | Status | Borrower | Loan Amount |
|---|---|---|---|
| Open | Dangler Shawn | $102,870 | |
| Previous Owner | Ditzel Jamie A | $99,949 |
Source: Public Records
Tax History Compared to Growth
Tax History
| Year | Tax Paid | Tax Assessment Tax Assessment Total Assessment is a certain percentage of the fair market value that is determined by local assessors to be the total taxable value of land and additions on the property. | Land | Improvement |
|---|---|---|---|---|
| 2025 | $6,422 | $178,500 | $47,400 | $131,100 |
| 2024 | $6,422 | $178,500 | $47,400 | $131,100 |
| 2023 | $6,089 | $178,500 | $47,400 | $131,100 |
| 2022 | $6,089 | $178,500 | $47,400 | $131,100 |
| 2021 | $5,848 | $178,500 | $47,400 | $131,100 |
| 2020 | $5,696 | $178,500 | $47,400 | $131,100 |
| 2019 | $5,582 | $178,500 | $47,400 | $131,100 |
| 2018 | $3,303 | $70,300 | $12,700 | $57,600 |
| 2017 | $3,300 | $70,300 | $12,700 | $57,600 |
| 2016 | $3,105 | $70,300 | $12,700 | $57,600 |
| 2015 | $2,950 | $70,300 | $12,700 | $57,600 |
| 2014 | $2,917 | $70,300 | $12,700 | $57,600 |
Source: Public Records
Map
Nearby Homes
- 4834 White Horse Pike
- 4821 Moss Mill Rd
- 700 Columbia Rd
- 4640 Frazier Ave
- 4930 Moss Mill Rd
- 0 Columbia Rd Unit NJAC2012962
- 0 Columbia Rd Unit 586593
- 154 24th Ave
- 900 Elwood Rd
- 900 Elwood Rd Unit MULLICA TWP
- 4501 S White Horse Pike
- 1021 Reading Ave
- 418 Melon Ave
- 270 4th Ave
- 551 Wharton Park Blvd
- 4179 E Adams Cir
- 4166 Anna Dr
- 547 Wharton Park Blvd
- 4160 Anna Dr
- 541 Wharton Park Blvd
- 510 Columbia Rd
- 4851 Old Egg Harbor Rd
- 446 Columbia Rd
- 520 Columbia Rd
- 521 Columbia Rd
- 528 Columbia Rd
- 511 Columbia Rd
- 531 Columbia Rd
- 538 Columbia Rd
- 4816 Old Egg Harbor Rd
- 419 Columbia Rd
- 4850 White Horse Pike
- 4815 Old Egg Harbor Rd
- 546 Columbia Rd
- 4900 White Horse Pike
- 4810 Old Egg Harbor Rd
- 4808 Old Egg Harbor Rd
- 4910 White Horse Pike
- 4822 White Horse Pike
- 4839 White Horse Pike