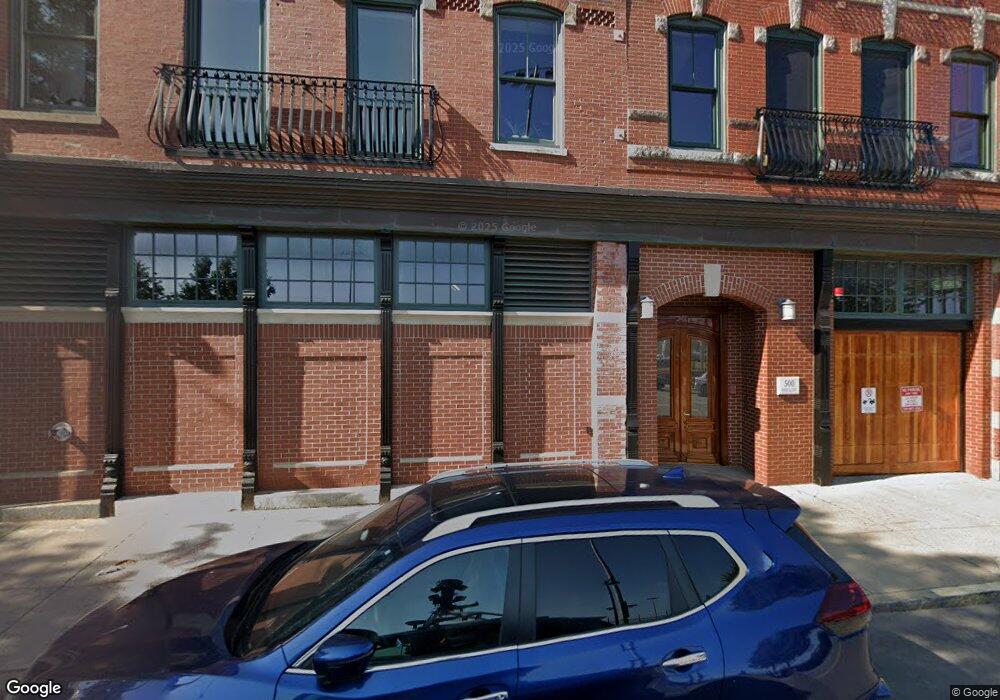
500 Commercial St Unit A Boston, MA 02109
North End NeighborhoodEstimated Value: $2,333,176 - $2,559,000
2
Beds
2
Baths
1,623
Sq Ft
$1,486/Sq Ft
Est. Value
About This Home
This home is located at 500 Commercial St Unit A, Boston, MA 02109 and is currently estimated at $2,411,794, approximately $1,486 per square foot. 500 Commercial St Unit A is a home located in Suffolk County with nearby schools including St John School, Boston Children's School, and Torit Montessori School.
Ownership History
Date
Name
Owned For
Owner Type
Purchase Details
Closed on
Dec 2, 2013
Sold by
Obrien Brendan J and Obrien Maryann
Bought by
Maryann Obrien T
Current Estimated Value
Purchase Details
Closed on
Sep 14, 2007
Sold by
Fitzgerald William J
Bought by
Obrien Brendan J and Obrien Maryann
Home Financials for this Owner
Home Financials are based on the most recent Mortgage that was taken out on this home.
Original Mortgage
$840,000
Interest Rate
6.7%
Mortgage Type
Purchase Money Mortgage
Purchase Details
Closed on
Jan 13, 2005
Sold by
Thornton John T and Thornton Patricia C
Bought by
Fitzgerald William F
Purchase Details
Closed on
Jun 2, 2000
Sold by
North Cove Llc
Bought by
Thorton John T and Thornton Patricia C
Purchase Details
Closed on
Oct 31, 1997
Sold by
Boston Redev Authority
Bought by
Comnmercial St Rt 500 and Juzwic William M
Home Financials for this Owner
Home Financials are based on the most recent Mortgage that was taken out on this home.
Original Mortgage
$950,000
Interest Rate
7.31%
Mortgage Type
Purchase Money Mortgage
Create a Home Valuation Report for This Property
The Home Valuation Report is an in-depth analysis detailing your home's value as well as a comparison with similar homes in the area
Home Values in the Area
Average Home Value in this Area
Purchase History
| Date | Buyer | Sale Price | Title Company |
|---|---|---|---|
| Maryann Obrien T | -- | -- | |
| Brendan J Obrien T | -- | -- | |
| Obrien Brendan J | $1,546,392 | -- | |
| Fitzgerald William F | $1,350,000 | -- | |
| Thorton John T | $810,000 | -- | |
| Comnmercial St Rt 500 | $133,000 | -- |
Source: Public Records
Mortgage History
| Date | Status | Borrower | Loan Amount |
|---|---|---|---|
| Previous Owner | Obrien Brendan J | $840,000 | |
| Previous Owner | Comnmercial St Rt 500 | $1,890,000 | |
| Previous Owner | Comnmercial St Rt 500 | $950,000 |
Source: Public Records
Tax History Compared to Growth
Tax History
| Year | Tax Paid | Tax Assessment Tax Assessment Total Assessment is a certain percentage of the fair market value that is determined by local assessors to be the total taxable value of land and additions on the property. | Land | Improvement |
|---|---|---|---|---|
| 2025 | $28,148 | $2,430,700 | $0 | $2,430,700 |
| 2024 | $25,529 | $2,342,100 | $0 | $2,342,100 |
| 2023 | $24,891 | $2,317,600 | $0 | $2,317,600 |
| 2022 | $24,245 | $2,228,400 | $0 | $2,228,400 |
| 2021 | $23,777 | $2,228,400 | $0 | $2,228,400 |
| 2020 | $21,981 | $2,081,500 | $0 | $2,081,500 |
| 2019 | $20,313 | $1,927,200 | $0 | $1,927,200 |
| 2018 | $19,237 | $1,835,600 | $0 | $1,835,600 |
| 2017 | $18,864 | $1,781,300 | $0 | $1,781,300 |
| 2016 | $18,602 | $1,691,095 | $0 | $1,691,095 |
| 2015 | $19,609 | $1,619,200 | $0 | $1,619,200 |
| 2014 | $18,319 | $1,456,200 | $0 | $1,456,200 |
Source: Public Records
Map
Nearby Homes
- 4-6 Henchman St Unit 4-6
- 190 Salem St Unit 2
- 190 Salem St Unit 3
- 53 Snow Hill St
- 7 Unity St Unit 3
- 24 Sheafe St Unit 1
- 144 Salem St
- 81 Prince St Unit 2
- 386 Commercial St Unit 4E
- 19 Salutation St Unit 52
- 61 Prince St Unit 1C
- 0 Fairfield Unit 71812438
- 14 N Bennet St Unit 1
- 14 N Bennet St Unit 2
- 126 Salem St Unit 3
- 133 Salem St
- 133 N Washington St
- 129 N Washington St Unit 3
- 2.5 Battery Wharf Unit 4302
- 6 Baldwin Place
- 500 Commercial St Unit C2
- 500 Commercial St Unit D
- 500 Commercial St Unit C1
- 500 Commercial St Unit B
- 500 Commercial St Unit E
- 500 Commercial St Unit PH-C
- 500 Commercial St Unit PHC 1-2
- 494 Commercial St Unit 496
- 492 Commercial St Unit 4
- 492 Commercial St Unit 3
- 492 Commercial St Unit 2
- 492 Commercial St
- 7 Jackson Ave
- 7 Jackson Ave
- 488 Commercial St Unit 3F
- 488 Commercial St
- 488 Commercial St Unit 1
- 488 Commercial St
- 488 Commercial St Unit 2
- 5 Charter St Unit 2L