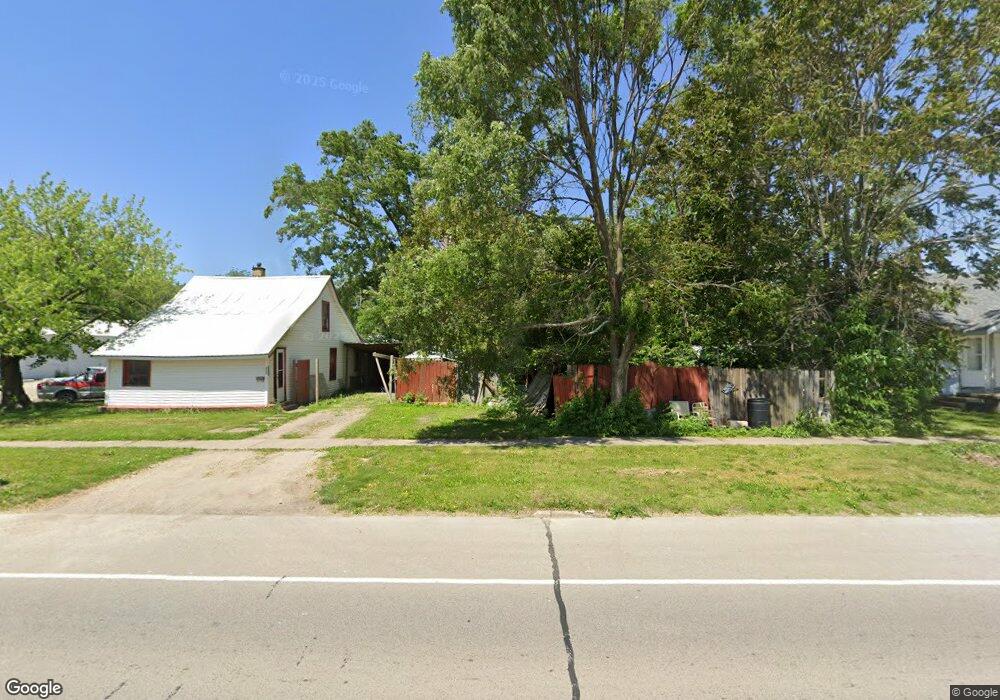
500 Dewitt Ave Mattoon, IL 61938
Estimated Value: $98,830
Studio
1
Bath
4,480
Sq Ft
$22/Sq Ft
Est. Value
About This Home
This home is located at 500 Dewitt Ave, Mattoon, IL 61938 and is currently estimated at $98,830, approximately $22 per square foot. 500 Dewitt Ave is a home located in Coles County with nearby schools including Mattoon High School and St. John's Lutheran School.
Ownership History
Date
Name
Owned For
Owner Type
Purchase Details
Closed on
Sep 16, 2021
Sold by
Phipps Kris A and Phipps David M
Bought by
Mattoon Youth Wrestling Booster Club Inc
Current Estimated Value
Home Financials for this Owner
Home Financials are based on the most recent Mortgage that was taken out on this home.
Original Mortgage
$65,700
Outstanding Balance
$59,693
Interest Rate
2.7%
Mortgage Type
Future Advance Clause Open End Mortgage
Estimated Equity
$39,137
Purchase Details
Closed on
Sep 18, 2019
Sold by
Greenfish Properties Inc
Bought by
Phipps Kris A and Phipps David M
Purchase Details
Closed on
Nov 23, 2009
Sold by
D A Properties
Bought by
Greenfish Properties Inc
Home Financials for this Owner
Home Financials are based on the most recent Mortgage that was taken out on this home.
Original Mortgage
$65,000
Interest Rate
5.05%
Mortgage Type
Future Advance Clause Open End Mortgage
Create a Home Valuation Report for This Property
The Home Valuation Report is an in-depth analysis detailing your home's value as well as a comparison with similar homes in the area
Home Values in the Area
Average Home Value in this Area
Purchase History
| Date | Buyer | Sale Price | Title Company |
|---|---|---|---|
| Mattoon Youth Wrestling Booster Club Inc | $73,000 | Attorney | |
| Phipps Kris A | $28,000 | None Available | |
| Greenfish Properties Inc | $52,500 | None Available |
Source: Public Records
Mortgage History
| Date | Status | Borrower | Loan Amount |
|---|---|---|---|
| Open | Mattoon Youth Wrestling Booster Club Inc | $65,700 | |
| Previous Owner | Greenfish Properties Inc | $65,000 |
Source: Public Records
Tax History
| Year | Tax Paid | Tax Assessment Tax Assessment Total Assessment is a certain percentage of the fair market value that is determined by local assessors to be the total taxable value of land and additions on the property. | Land | Improvement |
|---|---|---|---|---|
| 2024 | $2,601 | $30,071 | $3,508 | $26,563 |
| 2023 | $2,355 | $27,091 | $3,160 | $23,931 |
| 2022 | $2,355 | $26,644 | $3,108 | $23,536 |
| 2021 | $1,700 | $17,627 | $2,800 | $14,827 |
| 2020 | $1,684 | $18,263 | $2,901 | $15,362 |
| 2019 | $1,654 | $17,627 | $2,800 | $14,827 |
| 2018 | $1,624 | $17,627 | $2,800 | $14,827 |
| 2017 | $1,352 | $14,700 | $4,670 | $10,030 |
| 2016 | $1,324 | $14,700 | $4,670 | $10,030 |
| 2015 | $1,313 | $14,700 | $4,670 | $10,030 |
| 2014 | $1,313 | $14,700 | $4,670 | $10,030 |
| 2013 | $1,313 | $14,700 | $4,670 | $10,030 |
Source: Public Records
Map
Nearby Homes
- 421 Dewitt Ave
- 812 N 8th St Unit 64
- 812 N 8th St Unit 36
- 916 Piatt Ave
- 1205 Champaign Ave
- 1401 N 10th St
- 1 Brown Ct
- 1001 Wabash Ave
- 1412 Champaign Ave
- 1101 Wabash Ave
- 1612 Richmond Ave
- 1301 Lafayette Ave
- 705 Marion Ave
- 1312 Edgar Ave
- 420 Crestview Dr
- 1800 Piatt Ave
- 1509 Lafayette Ave
- 1905 Dewitt Ave
- 620 Odd Fellow Rd
- 1012 S 6th St
Your Personal Tour Guide
Ask me questions while you tour the home.