Estimated Value: $406,000 - $4,357,000
2
Beds
2
Baths
2,322
Sq Ft
$1,075/Sq Ft
Est. Value
About This Home
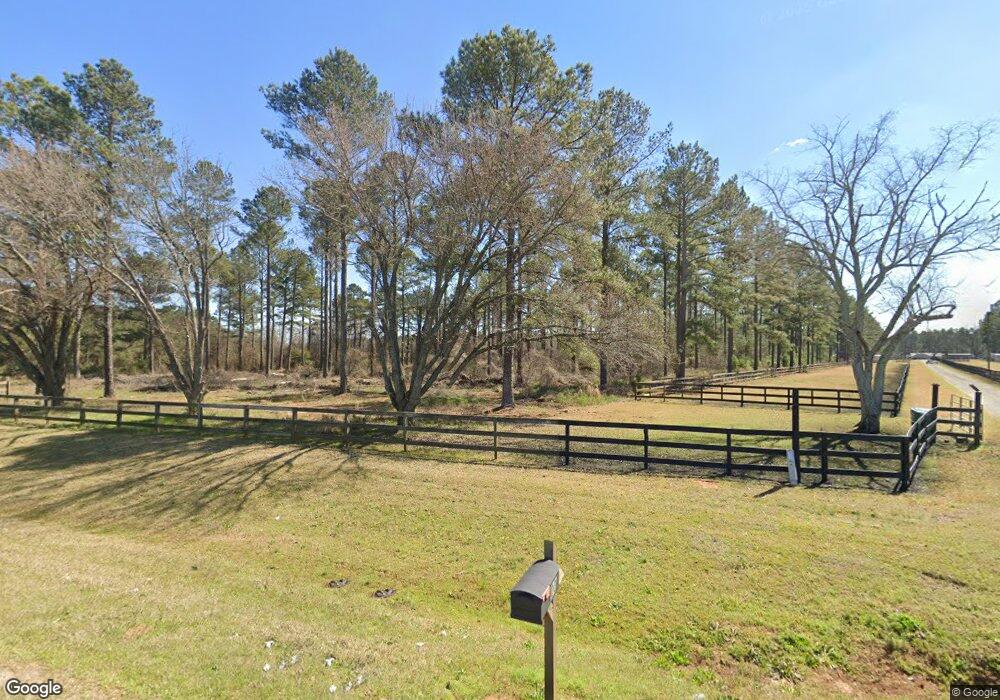
This home is located at 500 Ga 224, Perry, GA 31069 and is currently estimated at $2,495,029, approximately $1,074 per square foot. 500 Ga 224 is a home located in Houston County with nearby schools including Tucker Elementary School, Perry Middle School, and Perry High School.
Ownership History
Date
Name
Owned For
Owner Type
Purchase Details
Closed on
Oct 10, 2025
Sold by
Ocmulgee Fields Inc
Bought by
Ball Street Crossing Llc
Current Estimated Value
Purchase Details
Closed on
Apr 11, 2025
Sold by
Ocmulgee Fields Inc
Bought by
Carriker Dalton Alexander and Carriker Taylor
Purchase Details
Closed on
Jul 3, 2007
Sold by
224 Duke Llc
Bought by
Ocmulgee Fields Inc
Purchase Details
Closed on
Jan 13, 1998
Sold by
Forest America Inc
Bought by
Rose Land L P
Purchase Details
Closed on
Oct 23, 1997
Sold by
Argola Holdings Inc
Bought by
Forest America Inc
Purchase Details
Closed on
Jul 1, 1985
Sold by
Central Ga Production Credit A
Bought by
Argola Holdings Inc
Purchase Details
Closed on
Jun 4, 1985
Sold by
C Buchanan C and C M
Bought by
Central Ga Production Credit Asoc
Purchase Details
Closed on
Apr 26, 1983
Sold by
Dumas R Harry
Bought by
C Buchanan C and C M
Purchase Details
Closed on
Dec 30, 1965
Bought by
Dumas R Harry
Create a Home Valuation Report for This Property
The Home Valuation Report is an in-depth analysis detailing your home's value as well as a comparison with similar homes in the area
Home Values in the Area
Average Home Value in this Area
Purchase History
| Date | Buyer | Sale Price | Title Company |
|---|---|---|---|
| Ball Street Crossing Llc | $2,090,500 | None Listed On Document | |
| Ball Street Crossing Llc | $581,000 | None Listed On Document | |
| Carriker Dalton Alexander | $172,000 | None Listed On Document | |
| Carriker Dalton Alexander | $172,000 | None Listed On Document | |
| Ocmulgee Fields Inc | $2,752,900 | None Available | |
| Rose Land L P | $785,000 | -- | |
| Forest America Inc | $35,000 | -- | |
| Argola Holdings Inc | -- | -- | |
| Central Ga Production Credit Asoc | -- | -- | |
| C Buchanan C | -- | -- | |
| Dumas R Harry | -- | -- |
Source: Public Records
Tax History Compared to Growth
Tax History
| Year | Tax Paid | Tax Assessment Tax Assessment Total Assessment is a certain percentage of the fair market value that is determined by local assessors to be the total taxable value of land and additions on the property. | Land | Improvement |
|---|---|---|---|---|
| 2024 | $4,976 | $794,520 | $702,360 | $92,160 |
| 2023 | $4,519 | $604,640 | $530,160 | $74,480 |
| 2022 | $4,313 | $599,400 | $530,160 | $69,240 |
| 2021 | $4,113 | $593,456 | $530,160 | $63,296 |
| 2020 | $4,016 | $458,504 | $396,920 | $61,584 |
| 2019 | $3,942 | $458,504 | $396,920 | $61,584 |
| 2018 | $3,871 | $458,504 | $396,920 | $61,584 |
| 2017 | $3,806 | $458,504 | $396,920 | $61,584 |
| 2016 | $3,745 | $458,504 | $396,920 | $61,584 |
| 2015 | $3,687 | $458,504 | $396,920 | $61,584 |
| 2014 | -- | $458,504 | $396,920 | $61,584 |
| 2013 | -- | $458,496 | $396,920 | $61,576 |
Source: Public Records
Map
Nearby Homes
- 1011 Eagle Feather Trail
- 1010 Rock Rd
- 150 Moss Oaks Rd
- (5.41 acres) Redridge Ln
- 111 Cattle Dr
- 219 Barnyard Way
- Chelsea Plan at The Preserve at Agricultural Village
- Hayden Plan at The Preserve at Agricultural Village
- 204 Cattle Dr
- Elle Plan at The Preserve at Agricultural Village
- Vivian Plan at The Preserve at Agricultural Village
- Cali Plan at The Preserve at Agricultural Village
- 109 Cattle Dr
- 126 Farmers Way
- 116 Farmers Way Unit 233
- 109 Farmers Way
- 205 Cattle Dr
- 209 Cattle Dr
- 110 Cattle Dr
- 301 Preservation Pkwy
- 500 Ga Highway 224
- 500 Ga Highway 224
- 580 Ga Highway 224
- 580 Ga Hwy
- 580 Georgia 224
- 582 Ga Highway 224
- 412 Ga Highway 224
- 0 Duke Rd Unit 2 2993503
- 0 Duke Rd Unit 3235607
- 0 Duke Rd Unit 3235595
- 0 Duke Rd Unit 3254052
- 0 Duke Rd Unit TRACT 4 3270884
- 0 Duke Rd Unit TRACT 8 3274960
- 0 Duke Rd Unit TRACT 4 7094092
- 0 Duke Rd Unit 236486
- 0 Duke Rd Unit 8901146
- 0 Duke Rd Unit 206922
- 0 Duke Rd Unit 105627
- 6 Duke Rd
- 18 Duke Rd