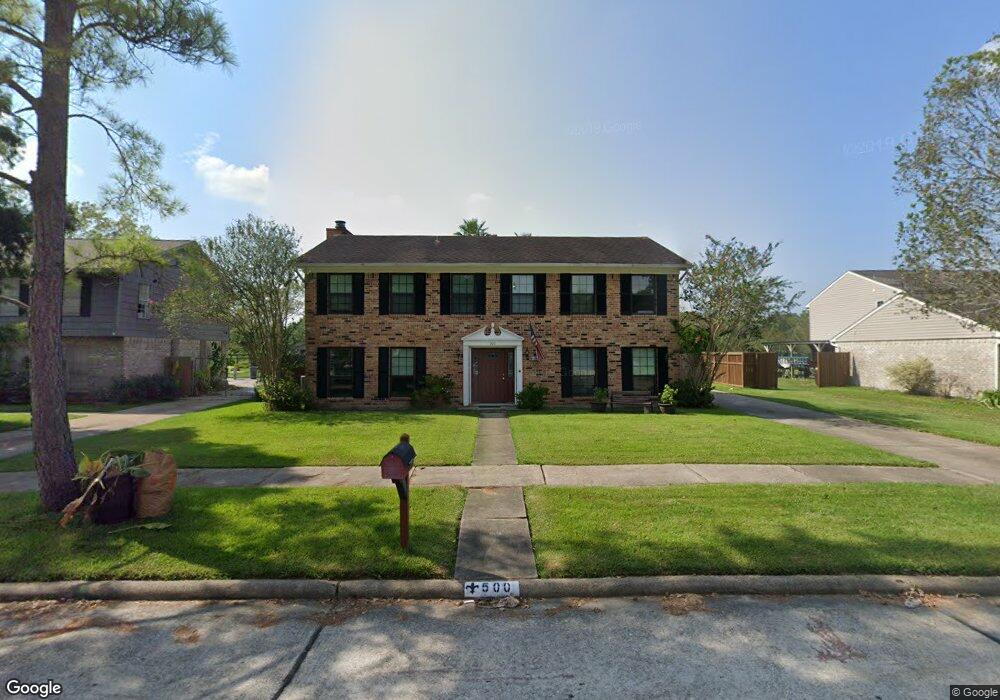
500 Gleneagles Dr Friendswood, TX 77546
Estimated Value: $332,000 - $350,000
--
Bed
3
Baths
2,376
Sq Ft
$143/Sq Ft
Est. Value
About This Home
This home is located at 500 Gleneagles Dr, Friendswood, TX 77546 and is currently estimated at $340,627, approximately $143 per square foot. 500 Gleneagles Dr is a home located in Galveston County with nearby schools including C.W. Cline Elementary School, Windsong Elementary School, and Friendswood Junior High School.
Ownership History
Date
Name
Owned For
Owner Type
Purchase Details
Closed on
Aug 29, 2023
Sold by
Smith Chad Michael and Smith Anne Margaret
Bought by
Smith Chad Michael and Smith Anne Margaret
Current Estimated Value
Purchase Details
Closed on
May 24, 2021
Sold by
Lamb Capital Investment Group
Bought by
Smith Anne and Smith Chaed
Purchase Details
Closed on
Sep 4, 2016
Sold by
Williams Christopher Alan and Williams Christopher Allen
Bought by
Smith Chad M
Purchase Details
Closed on
Nov 10, 2005
Sold by
Crame Leonard W and Crame Madonna E
Bought by
Smith Chad M and Smith Elizabeth W
Home Financials for this Owner
Home Financials are based on the most recent Mortgage that was taken out on this home.
Original Mortgage
$119,200
Interest Rate
5.9%
Mortgage Type
Fannie Mae Freddie Mac
Create a Home Valuation Report for This Property
The Home Valuation Report is an in-depth analysis detailing your home's value as well as a comparison with similar homes in the area
Home Values in the Area
Average Home Value in this Area
Purchase History
| Date | Buyer | Sale Price | Title Company |
|---|---|---|---|
| Smith Chad Michael | -- | None Listed On Document | |
| Smith Anne | -- | Stewart Title | |
| Smith Chad M | -- | None Available | |
| Smith Chad M | -- | South Land Title Company |
Source: Public Records
Mortgage History
| Date | Status | Borrower | Loan Amount |
|---|---|---|---|
| Previous Owner | Smith Chad M | $119,200 |
Source: Public Records
Tax History Compared to Growth
Tax History
| Year | Tax Paid | Tax Assessment Tax Assessment Total Assessment is a certain percentage of the fair market value that is determined by local assessors to be the total taxable value of land and additions on the property. | Land | Improvement |
|---|---|---|---|---|
| 2025 | $4,526 | $336,600 | -- | -- |
| 2024 | $4,526 | $319,950 | $51,160 | $268,790 |
| 2023 | $4,526 | $304,504 | $0 | $0 |
| 2022 | $6,097 | $276,822 | $0 | $0 |
| 2021 | $5,878 | $304,920 | $51,160 | $253,760 |
| 2020 | $5,512 | $261,350 | $51,160 | $210,190 |
| 2019 | $5,281 | $207,980 | $36,570 | $171,410 |
| 2018 | $5,364 | $210,010 | $36,570 | $173,440 |
| 2017 | $5,064 | $212,100 | $36,570 | $175,530 |
| 2016 | $4,604 | $198,080 | $36,570 | $161,510 |
| 2015 | $1,464 | $174,490 | $36,570 | $137,920 |
| 2014 | $1,378 | $146,510 | $36,570 | $109,940 |
Source: Public Records
Map
Nearby Homes
- 644 E Castle Harbour Dr
- 601 E Castle Harbour Dr
- 40 Windsong Ln
- 2512 Ravenna Ct
- 251 Saint Cloud Dr
- 2082 Wilderness Trail
- 902 Longleaf Ct
- 110 Dorado Dr
- 1607 Orlando St
- 1910 N Mission Cir
- 2211 S Mission Cir
- Amalfi Plan at Friendswood Trails
- Portofino Plan at Friendswood Trails
- Postiano Plan at Friendswood Trails
- Capri Plan at Friendswood Trails
- Ravello Plan at Friendswood Trails
- 1016 Applewood Dr
- 2605 S Mission Cir
- 1508 Harvest Vine Ct
- 2829 Fairway Dr
- 448 Gleneagles Dr
- 504 Gleneagles Dr
- 444 Gleneagles Dr
- 508 Gleneagles Dr
- 503 Gleneagles Dr
- 447 Gleneagles Dr
- 440 Gleneagles Dr
- 507 Gleneagles Dr
- 443 Gleneagles Dr
- 512 Gleneagles Dr
- 511 Gleneagles Dr
- 439 Gleneagles Dr
- 436 Gleneagles Dr
- 516 Gleneagles Dr
- 448 Old Course Dr
- 444 Old Course Dr
- 515 Gleneagles Dr
- 444 Old
- 435 Gleneagles Dr
- 500 Old Course Dr