Estimated Value: $833,814 - $931,000
4
Beds
3
Baths
2,021
Sq Ft
$442/Sq Ft
Est. Value
About This Home
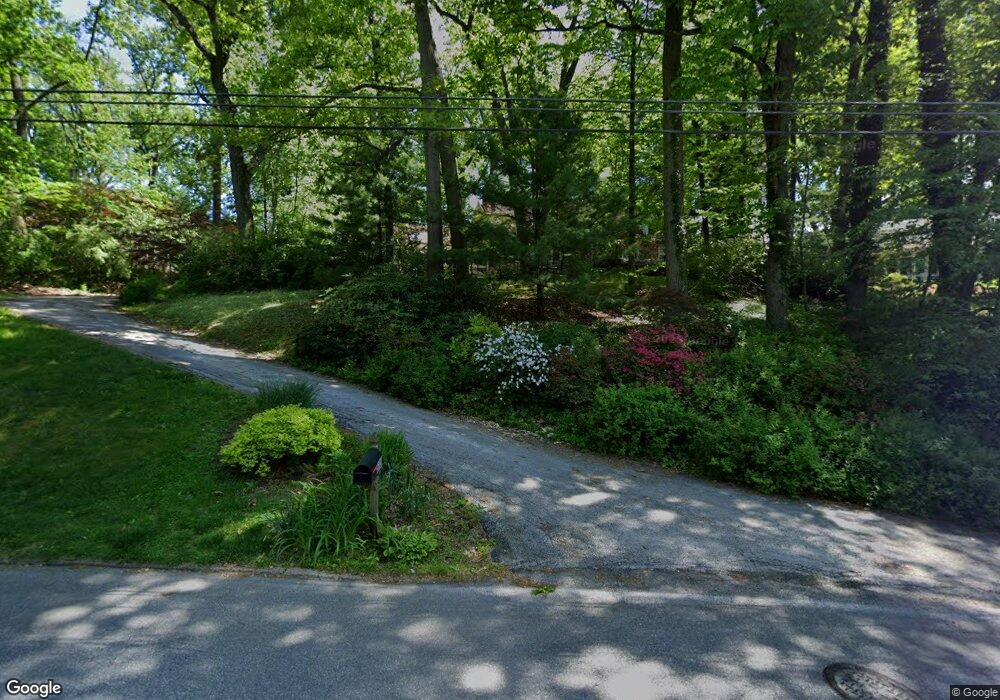
This home is located at 500 Hilltop Rd, Paoli, PA 19301 and is currently estimated at $892,454, approximately $441 per square foot. 500 Hilltop Rd is a home located in Chester County with nearby schools including Hillside Elementary School, Valley Forge Middle School, and Conestoga Senior High School.
Ownership History
Date
Name
Owned For
Owner Type
Purchase Details
Closed on
Dec 16, 2011
Sold by
Levin Larry and Levin Kimberly
Bought by
Levin Kimberly and Bugher David
Current Estimated Value
Purchase Details
Closed on
Mar 17, 2005
Sold by
Levin Larry
Bought by
Levin Kimberly
Purchase Details
Closed on
Dec 31, 2004
Sold by
Levin Larry
Bought by
Levin Kimberly
Purchase Details
Closed on
Dec 21, 2003
Sold by
Levin Larry
Bought by
Levin Kimberly
Purchase Details
Closed on
May 15, 2002
Sold by
Levin Larry
Bought by
Levin Kimberly
Purchase Details
Closed on
Dec 4, 2001
Sold by
Levin Larry
Bought by
Levin Kimberly
Purchase Details
Closed on
Dec 20, 2000
Sold by
Levin Larry
Bought by
Levin Kimberly
Purchase Details
Closed on
Aug 14, 1996
Sold by
Mccartney James R and Mccartney Joanne Z
Bought by
Levin Larry
Create a Home Valuation Report for This Property
The Home Valuation Report is an in-depth analysis detailing your home's value as well as a comparison with similar homes in the area
Home Values in the Area
Average Home Value in this Area
Purchase History
| Date | Buyer | Sale Price | Title Company |
|---|---|---|---|
| Levin Kimberly | -- | None Available | |
| Levin Kimberly | -- | -- | |
| Levin Kimberly | -- | -- | |
| Levin Kimberly | -- | -- | |
| Levin Kimberly | -- | -- | |
| Levin Kimberly | -- | -- | |
| Levin Kimberly | -- | -- | |
| Levin Larry | $275,000 | -- |
Source: Public Records
Tax History Compared to Growth
Tax History
| Year | Tax Paid | Tax Assessment Tax Assessment Total Assessment is a certain percentage of the fair market value that is determined by local assessors to be the total taxable value of land and additions on the property. | Land | Improvement |
|---|---|---|---|---|
| 2025 | $8,493 | $241,130 | $68,920 | $172,210 |
| 2024 | $8,493 | $241,130 | $68,920 | $172,210 |
| 2023 | $7,978 | $241,130 | $68,920 | $172,210 |
| 2022 | $7,772 | $241,130 | $68,920 | $172,210 |
| 2021 | $7,625 | $241,130 | $68,920 | $172,210 |
| 2020 | $7,414 | $241,130 | $68,920 | $172,210 |
| 2019 | $7,180 | $241,130 | $68,920 | $172,210 |
| 2018 | $7,038 | $241,130 | $68,920 | $172,210 |
| 2017 | $6,870 | $241,130 | $68,920 | $172,210 |
| 2016 | -- | $241,130 | $68,920 | $172,210 |
| 2015 | -- | $241,130 | $68,920 | $172,210 |
| 2014 | -- | $241,130 | $68,920 | $172,210 |
Source: Public Records
Map
Nearby Homes
- 109 Vincent Rd
- 202 Shoreline Dr
- 1250 Swedesford Rd
- 106 N Valley Rd
- 5 Kent Ln
- 1242 Old Lancaster Rd
- 1 Whitworth Ave
- 211 Wooded Way
- 521 Foxwood Ln
- 1441 Berwyn Paoli Rd
- 2102 Quail Ridge Dr
- 896 Conestoga Rd
- 1304 Weatherstone Dr Unit 1304
- 32 Manchester Ct
- 21 Manor Rd
- 29 Manor Rd
- 1705 Weatherstone Dr
- 793 Tory Hollow Rd
- 12 Moreland Rd
- 104 Lynbrook Rd
- 494 Hilltop Rd
- 508 Hilltop Rd
- 366 Friendship Dr
- 370 Friendship Dr
- 362 Friendship Dr
- 495 Hilltop Rd
- 516 Hilltop Rd
- 356 Friendship Dr
- 374 Friendship Dr
- 504 Hilltop Rd
- 363 Friendship Dr
- 474 Hilltop Rd
- 524 Hilltop Rd
- 525 Hilltop Rd
- 375 Friendship Dr
- 357 Friendship Dr
- 502 Virginia Ave
- 367 Friendship Dr
- 378 Friendship Dr
- 3 Stonehill Ln