Estimated Value: $80,000 - $120,000
3
Beds
2
Baths
1,528
Sq Ft
$65/Sq Ft
Est. Value
About This Home
This home is located at 500 J P Rogers Rd, Pavo, GA 31778 and is currently estimated at $98,793, approximately $64 per square foot. 500 J P Rogers Rd is a home located in Brooks County with nearby schools including North Brooks Elementary School.
Ownership History
Date
Name
Owned For
Owner Type
Purchase Details
Closed on
Sep 28, 2021
Sold by
Howerton Libby Renee
Bought by
Harrell Shawn
Current Estimated Value
Purchase Details
Closed on
Jul 24, 2008
Sold by
Howerton Libby
Bought by
Howerton Libby and Friedman John E
Purchase Details
Closed on
Feb 11, 2003
Bought by
Hubbard Frances
Purchase Details
Closed on
Sep 19, 2001
Sold by
Pinion Frank Arthur
Bought by
Hubbard Frances
Purchase Details
Closed on
Jun 8, 2001
Sold by
Howerton Libby Renee
Bought by
Howerton Libby Renee and Howerton William L
Purchase Details
Closed on
May 25, 2001
Sold by
Pinion Frank Arthur
Bought by
Howerton Libby Renee
Purchase Details
Closed on
Oct 12, 2000
Sold by
Pinion Frank Arthur Lee
Bought by
Howerton Libby Renee
Purchase Details
Closed on
Jan 18, 2000
Sold by
Dean Wayne
Bought by
Pinion Frank Arthur
Purchase Details
Closed on
Jul 7, 1999
Sold by
Ward Gary and Ward Barbara
Bought by
Dean Wayne
Purchase Details
Closed on
Dec 8, 1996
Bought by
Ward Gary and Ward Barbara
Create a Home Valuation Report for This Property
The Home Valuation Report is an in-depth analysis detailing your home's value as well as a comparison with similar homes in the area
Home Values in the Area
Average Home Value in this Area
Purchase History
| Date | Buyer | Sale Price | Title Company |
|---|---|---|---|
| Harrell Shawn | $75,000 | -- | |
| Howerton Libby | -- | -- | |
| Hubbard Frances | $3,800 | -- | |
| Hubbard Frances | $4,000 | -- | |
| Howerton Libby Renee | -- | -- | |
| Howerton Libby Renee | -- | -- | |
| Pinion Frank Arthur | -- | -- | |
| Howerton Libby Renee | -- | -- | |
| Pinion Frank Arthur | $18,500 | -- | |
| Dean Wayne | $18,000 | -- | |
| Ward Gary | -- | -- |
Source: Public Records
Tax History Compared to Growth
Tax History
| Year | Tax Paid | Tax Assessment Tax Assessment Total Assessment is a certain percentage of the fair market value that is determined by local assessors to be the total taxable value of land and additions on the property. | Land | Improvement |
|---|---|---|---|---|
| 2025 | $791 | $20,980 | $17,600 | $3,380 |
| 2024 | $791 | $20,980 | $17,600 | $3,380 |
| 2023 | $747 | $19,280 | $16,680 | $2,600 |
| 2022 | $773 | $18,492 | $15,880 | $2,612 |
| 2021 | $874 | $27,664 | $15,560 | $12,104 |
| 2020 | $771 | $27,765 | $15,560 | $12,205 |
| 2019 | $859 | $28,357 | $15,880 | $12,477 |
| 2018 | $810 | $27,740 | $15,080 | $12,660 |
| 2017 | $813 | $10,083 | $0 | $10,083 |
| 2016 | $834 | $24,130 | $0 | $0 |
| 2015 | -- | $22,004 | $0 | $0 |
| 2014 | -- | $27,484 | $15,360 | $12,124 |
| 2013 | -- | $27,204 | $15,080 | $12,124 |
Source: Public Records
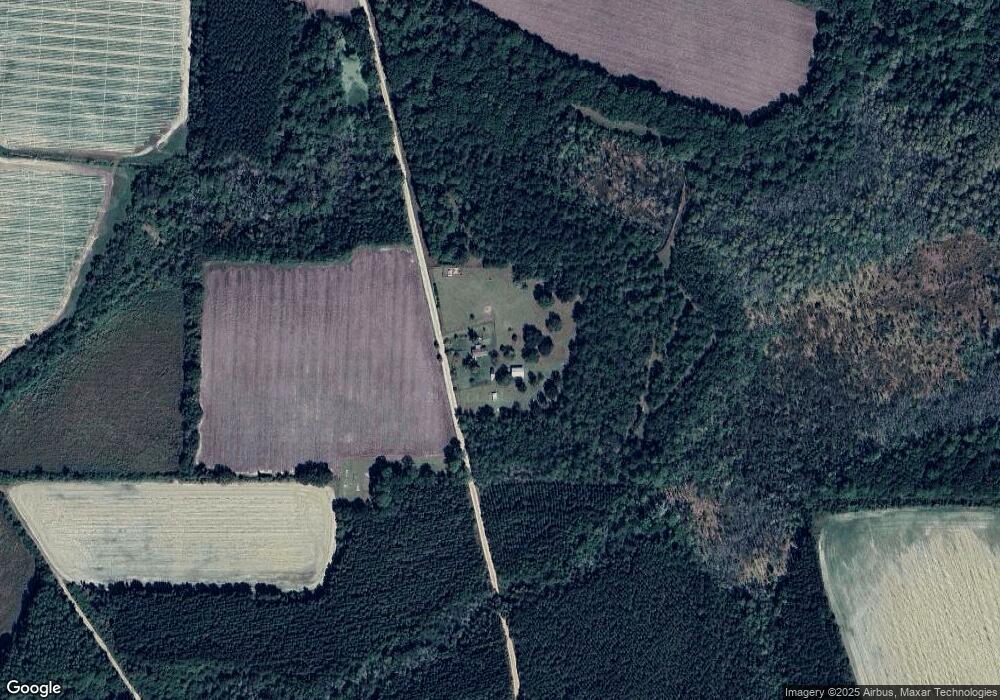
Map
Nearby Homes
- 16343 Georgia 33
- 16343 Ga Hwy 33 -8 34 Acres
- 16343
- 16343 Ga Hwy 33 - 8 34 Acres Hwy
- 2051 W Pear St
- 0 Upper Trail Unit 913421
- 0 Upper Trail Unit 913422
- 2055 S Roberts St
- 1230 Parrish Rd
- 182 Horseshoe Dr
- 9283 Tallokas Rd Unit 54/13
- 9283 Tallokas Rd
- 00 Ragin Rd Unit 7
- 00 Ragin Rd Unit 12
- 1557 US Highway 319 S
- xx Ga Hwy 319 N
- XX Us Highway 319 S Unit 8-11
- 117 Will Rd
- 124 Flint Dr
- 114 Baell Trace Ct SE
- 730 Jp Rogers Rd
- 2231 Cannon Rd
- Lot #3 Hamp Rogers Rd
- 4 Acres Hamp Rogers Rd
- Lot #2 Hamp Rogers Rd
- 0 Walden Rd
- 1137 Walden Rd
- 928 Walden Rd
- 4216 Ione Rd
- 4576 Ione Rd
- 1404 Walden Rd
- 1505 Cannon Rd
- 586 Walden Rd
- 00 Cannon Rd
- 4367 Ione Rd
- 4463 Ione Rd
- 4485 Ione Rd
- 4743 Ione Rd
- 351 Walden Rd
- 1766 Walden Rd