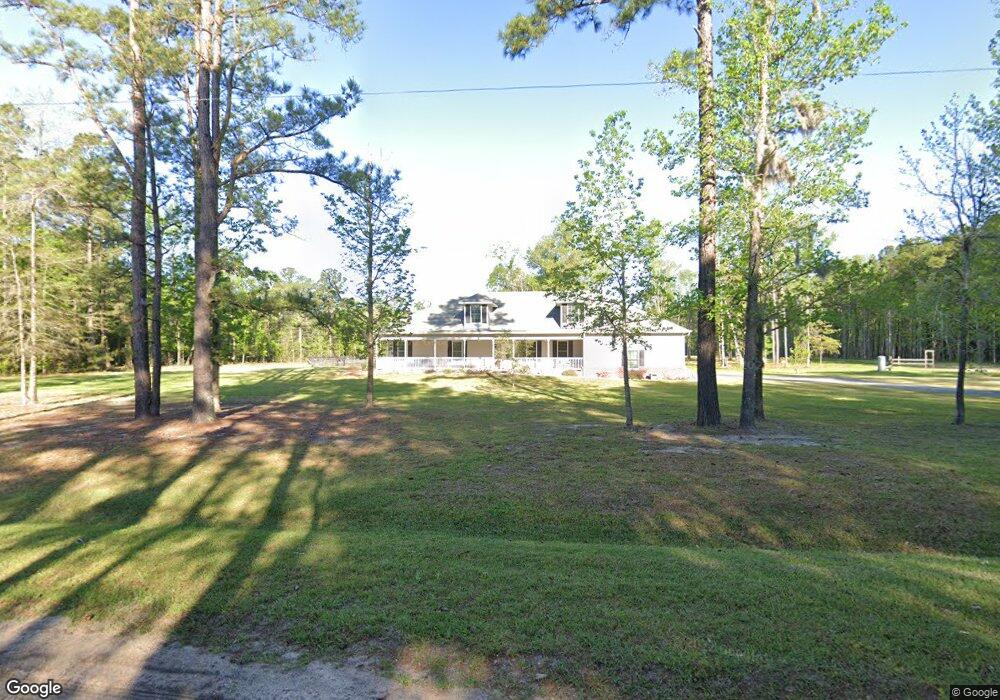
500 Keller Rd Port Wentworth, GA 31407
Estimated Value: $611,000 - $927,106
3
Beds
2
Baths
1,977
Sq Ft
$362/Sq Ft
Est. Value
About This Home
This home is located at 500 Keller Rd, Port Wentworth, GA 31407 and is currently estimated at $715,027, approximately $361 per square foot. 500 Keller Rd is a home with nearby schools including South Effingham Elementary School, South Effingham Middle School, and South Effingham High School.
Ownership History
Date
Name
Owned For
Owner Type
Purchase Details
Closed on
Aug 31, 2020
Sold by
Alvarez Richard J
Bought by
Scaccia Eugene and Scaccia Meredith
Current Estimated Value
Home Financials for this Owner
Home Financials are based on the most recent Mortgage that was taken out on this home.
Original Mortgage
$348,000
Outstanding Balance
$241,866
Interest Rate
2.9%
Mortgage Type
New Conventional
Estimated Equity
$473,161
Purchase Details
Closed on
Oct 11, 2017
Sold by
Grass Chad
Bought by
Alvarez Richard J
Home Financials for this Owner
Home Financials are based on the most recent Mortgage that was taken out on this home.
Original Mortgage
$252,000
Interest Rate
3.78%
Mortgage Type
New Conventional
Purchase Details
Closed on
Aug 23, 2013
Sold by
Barber Sherry O
Bought by
Grass Chad and Grass Robyn
Purchase Details
Closed on
Jan 4, 2000
Bought by
Barber Sherry O
Create a Home Valuation Report for This Property
The Home Valuation Report is an in-depth analysis detailing your home's value as well as a comparison with similar homes in the area
Home Values in the Area
Average Home Value in this Area
Purchase History
| Date | Buyer | Sale Price | Title Company |
|---|---|---|---|
| Scaccia Eugene | $435,000 | -- | |
| Alvarez Richard J | $315,000 | -- | |
| Grass Chad | $52,000 | -- | |
| Barber Sherry O | -- | -- |
Source: Public Records
Mortgage History
| Date | Status | Borrower | Loan Amount |
|---|---|---|---|
| Open | Scaccia Eugene | $348,000 | |
| Previous Owner | Alvarez Richard J | $252,000 |
Source: Public Records
Tax History Compared to Growth
Tax History
| Year | Tax Paid | Tax Assessment Tax Assessment Total Assessment is a certain percentage of the fair market value that is determined by local assessors to be the total taxable value of land and additions on the property. | Land | Improvement |
|---|---|---|---|---|
| 2024 | $5,909 | $242,640 | $133,456 | $109,184 |
| 2023 | $6,447 | $258,799 | $158,800 | $99,999 |
| 2022 | $346 | $181,589 | $76,224 | $105,365 |
| 2021 | $4,903 | $161,132 | $76,224 | $84,908 |
| 2020 | $3,324 | $104,157 | $24,773 | $79,384 |
| 2019 | $3,345 | $104,157 | $24,773 | $79,384 |
| 2018 | $3,221 | $98,381 | $24,773 | $73,608 |
| 2017 | $3,004 | $97,787 | $24,773 | $73,014 |
| 2016 | $2,869 | $100,900 | $24,773 | $76,128 |
| 2015 | -- | $89,911 | $20,356 | $69,555 |
| 2014 | -- | $20,356 | $20,356 | $0 |
| 2013 | -- | $18,175 | $18,175 | $0 |
Source: Public Records
Map
Nearby Homes
- 2410 Hodgeville Rd
- 203 Orchard Dr
- 353 Moss Loop
- 416 Moss Loop
- 124 Breaklands Ct
- 114 Claystone Ct
- 116 Breaklands Ct
- 158 Troupe Dr
- 3 Chandler Bluff Dr
- 16 Holly Springs Cir
- 42 Westbourne Way
- 9 Chandler Bluff Dr
- 18 Allen Brook Dr
- 75 Redwall Cir
- 58 Winslow Cir
- 123 Telford St
- 38 Ashleigh Ln
- 106 Saddle Ln
- 54 Godley Park Way
- 54 Winslow Cir
- 406 Keller Rd
- 500 Keller Rd
- 497 Keller Rd
- 324 Keller Rd
- 326 Keller Rd
- 550 Keller Rd
- 597 Keller Rd
- 350 Keller Rd
- 607 Keller Rd
- 116 S Pointe Dr
- 114 S Pointe Dr
- 112 S Pointe Dr
- 115 S Pointe Dr
- 110 S Pointe Dr
- 108 S Pointe Dr
- 203 Partridge Ct
- 106 S Pointe Dr
- 104 S Pointe Dr
- 201 Partridge Ct Unit 62
- 201 Partridge Ct