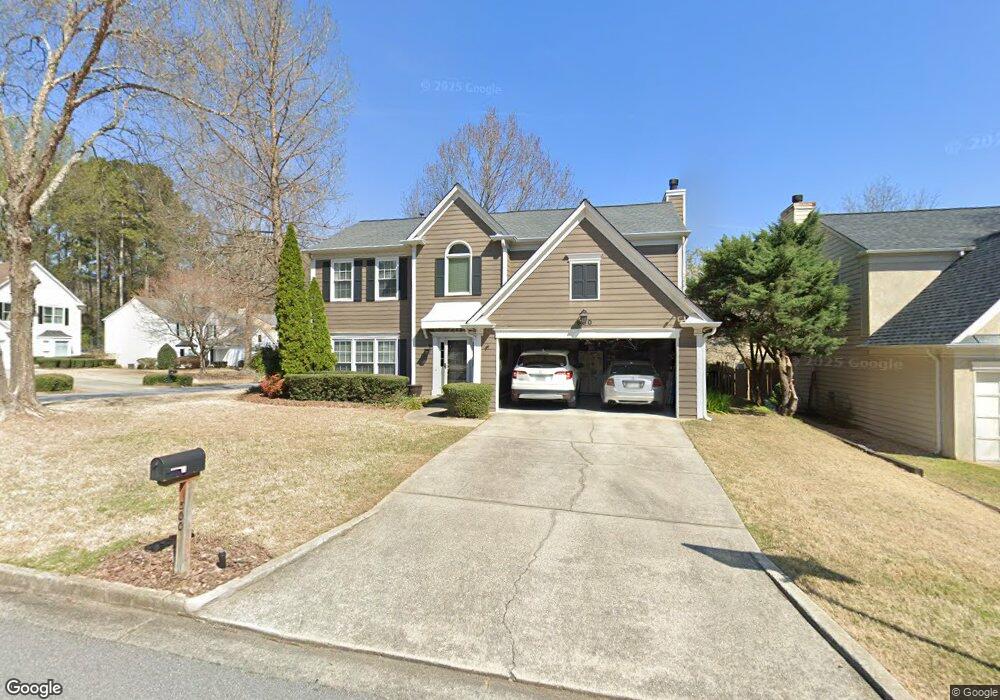
500 Lathkil Ct Alpharetta, GA 30022
Newtown NeighborhoodEstimated Value: $539,000 - $625,187
4
Beds
3
Baths
2,480
Sq Ft
$237/Sq Ft
Est. Value
About This Home
This home is located at 500 Lathkil Ct, Alpharetta, GA 30022 and is currently estimated at $588,797, approximately $237 per square foot. 500 Lathkil Ct is a home located in Fulton County with nearby schools including Barnwell Elementary School, Autrey Mill Middle School, and Johns Creek High School.
Ownership History
Date
Name
Owned For
Owner Type
Purchase Details
Closed on
Dec 16, 2005
Sold by
Risner Andrew B
Bought by
Risner Andrew B and Risner Molly S
Current Estimated Value
Home Financials for this Owner
Home Financials are based on the most recent Mortgage that was taken out on this home.
Original Mortgage
$256,900
Outstanding Balance
$149,726
Interest Rate
7%
Mortgage Type
New Conventional
Estimated Equity
$439,071
Purchase Details
Closed on
Jul 11, 2003
Sold by
Hart Carolyn H and Hart James E
Bought by
Bakal Renee
Home Financials for this Owner
Home Financials are based on the most recent Mortgage that was taken out on this home.
Original Mortgage
$212,400
Interest Rate
5.16%
Mortgage Type
New Conventional
Purchase Details
Closed on
Jan 30, 1997
Sold by
Thakore Shishir B Darshna
Bought by
Hart Carolyn H James E
Create a Home Valuation Report for This Property
The Home Valuation Report is an in-depth analysis detailing your home's value as well as a comparison with similar homes in the area
Home Values in the Area
Average Home Value in this Area
Purchase History
| Date | Buyer | Sale Price | Title Company |
|---|---|---|---|
| Risner Andrew B | -- | -- | |
| Risner Andrew B | $256,900 | -- | |
| Bakal Renee | $236,000 | -- | |
| Hart Carolyn H James E | $146,500 | -- |
Source: Public Records
Mortgage History
| Date | Status | Borrower | Loan Amount |
|---|---|---|---|
| Open | Risner Andrew B | $256,900 | |
| Previous Owner | Bakal Renee | $212,400 | |
| Closed | Hart Carolyn H James E | $0 |
Source: Public Records
Tax History Compared to Growth
Tax History
| Year | Tax Paid | Tax Assessment Tax Assessment Total Assessment is a certain percentage of the fair market value that is determined by local assessors to be the total taxable value of land and additions on the property. | Land | Improvement |
|---|---|---|---|---|
| 2025 | $3,391 | $234,920 | $46,880 | $188,040 |
| 2023 | $6,073 | $215,160 | $43,600 | $171,560 |
| 2022 | $3,242 | $169,720 | $32,440 | $137,280 |
| 2021 | $3,206 | $147,360 | $29,280 | $118,080 |
| 2020 | $3,225 | $141,080 | $26,400 | $114,680 |
| 2019 | $390 | $142,680 | $25,400 | $117,280 |
| 2018 | $3,531 | $126,240 | $24,880 | $101,360 |
| 2017 | $3,150 | $104,720 | $20,480 | $84,240 |
| 2016 | $3,048 | $103,280 | $20,480 | $82,800 |
| 2015 | $3,082 | $103,280 | $20,480 | $82,800 |
| 2014 | $2,730 | $90,440 | $13,160 | $77,280 |
Source: Public Records
Map
Nearby Homes
- 300 Olmstead Way
- 201 Downing Dr Unit 76
- 10255 Old Woodland Entry
- 10000 Barston Ct
- 320 Outwood Mill Ct
- 130 Forrest View Terrace
- 10085 Old Woodland Entry
- 615 S Preston Ct
- 305 Birch Rill Dr
- 10050 Lauren Hall Ct
- 10090 Jones Bridge Rd Unit 8
- 385 Birch Rill Dr
- 595 Oak Alley Way
- 3077 Haynes Trail
- 3273 Long Indian Creek Ct
- 415 Wood Trace Ct
- 235 Wood Shoals Ct
- 10421 Park Walk Point
- 125 Thome Dr
- 9715 Almaviva Dr
- 510 Lathkil Ct
- 615 Barston Ln
- 520 Lathkil Ct
- 0 Lathkil Ct Unit 7042707
- 0 Lathkil Ct Unit 8425772
- 0 Lathkil Ct Unit 8161137
- 0 Lathkil Ct
- 9090 Brockham Way
- 9105 Brockham Way
- 9095 Brockham Way
- 625 Barston Ln
- 9115 Brockham Way Unit II
- 530 Lathkil Ct
- 9085 Brockham Way
- 515 Lathkil Ct
- 635 Barston Ln
- 600 Barston Ln Unit 2
- 9125 Brockham Way Unit II
- 610 Barston Ln
- 9080 Brockham Way Unit 16