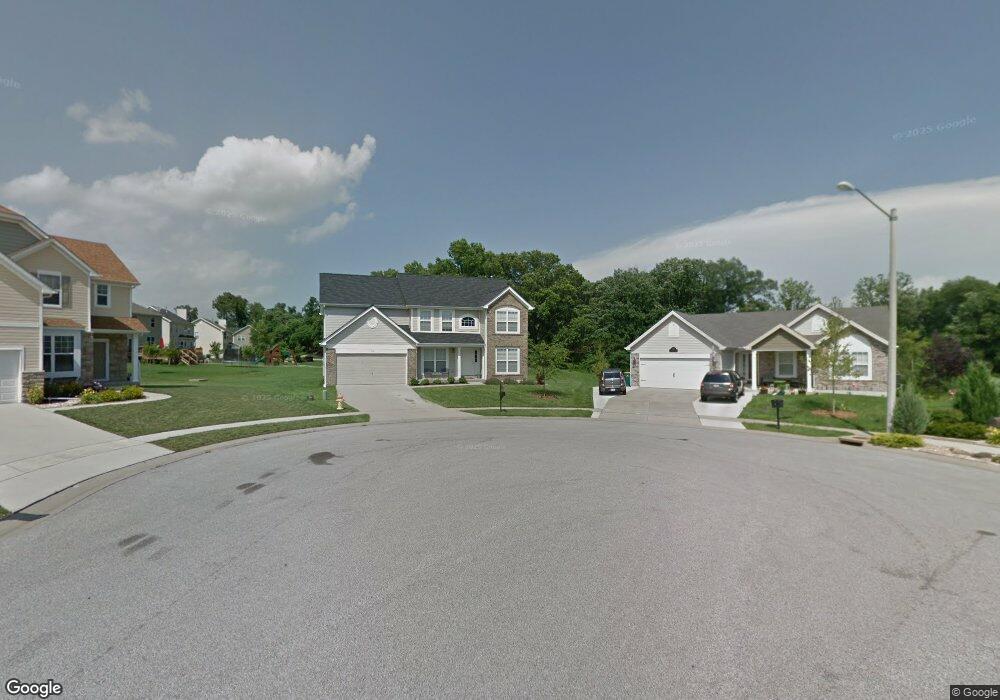
500 Longfellow Dr O Fallon, IL 62269
Estimated Value: $438,489 - $471,000
Studio
--
Bath
1,467
Sq Ft
$310/Sq Ft
Est. Value
About This Home
This home is located at 500 Longfellow Dr, O Fallon, IL 62269 and is currently estimated at $454,372, approximately $309 per square foot. 500 Longfellow Dr is a home located in St. Clair County with nearby schools including Schaefer Elementary School, Fulton Junior High School, and O'Fallon Township High School.
Ownership History
Date
Name
Owned For
Owner Type
Purchase Details
Closed on
Apr 19, 2011
Sold by
Harris Wesley N and Harris Mary E
Bought by
Harris Wesley N and The Wesley N & Mary E Harris Revocable T
Current Estimated Value
Purchase Details
Closed on
Mar 19, 2009
Sold by
Mayer Custom Homes Inc
Bought by
Harris Wesley and Harris Mary
Home Financials for this Owner
Home Financials are based on the most recent Mortgage that was taken out on this home.
Original Mortgage
$236,443
Outstanding Balance
$150,903
Interest Rate
5.2%
Mortgage Type
New Conventional
Estimated Equity
$303,469
Purchase Details
Closed on
Oct 20, 2005
Sold by
Windsor Creek Llc
Bought by
Mayer Manors Inc
Home Financials for this Owner
Home Financials are based on the most recent Mortgage that was taken out on this home.
Original Mortgage
$65,000,000
Interest Rate
5.82%
Mortgage Type
Purchase Money Mortgage
Create a Home Valuation Report for This Property
The Home Valuation Report is an in-depth analysis detailing your home's value as well as a comparison with similar homes in the area
Home Values in the Area
Average Home Value in this Area
Purchase History
| Date | Buyer | Sale Price | Title Company |
|---|---|---|---|
| Harris Wesley N | -- | None Available | |
| Harris Wesley | $263,000 | Benchmark Title Company | |
| Mayer Manors Inc | $2,274,000 | Benchmark Title Company |
Source: Public Records
Mortgage History
| Date | Status | Borrower | Loan Amount |
|---|---|---|---|
| Open | Harris Wesley | $236,443 | |
| Previous Owner | Mayer Manors Inc | $65,000,000 |
Source: Public Records
Tax History
| Year | Tax Paid | Tax Assessment Tax Assessment Total Assessment is a certain percentage of the fair market value that is determined by local assessors to be the total taxable value of land and additions on the property. | Land | Improvement |
|---|---|---|---|---|
| 2024 | $9,664 | $141,468 | $35,398 | $106,070 |
| 2023 | $8,976 | $125,171 | $31,320 | $93,851 |
| 2022 | $7,945 | $109,998 | $30,697 | $79,301 |
| 2021 | $7,664 | $104,402 | $29,135 | $75,267 |
| 2020 | $7,616 | $98,895 | $27,598 | $71,297 |
| 2019 | $7,431 | $98,895 | $27,598 | $71,297 |
| 2018 | $6,626 | $88,304 | $21,872 | $66,432 |
| 2017 | $6,565 | $84,722 | $20,985 | $63,737 |
| 2016 | $6,553 | $82,809 | $20,511 | $62,298 |
| 2014 | $5,915 | $79,956 | $20,559 | $59,397 |
| 2013 | $7,004 | $81,430 | $20,938 | $60,492 |
Source: Public Records
Map
Nearby Homes
- 1309 Coleridge Ct
- 1361 Dove Hollow Cir
- 700 Thoreau Dr
- 708 Longfellow Dr
- 1109 Macintosh Ct
- 1240 Pausch Rd Unit 6.65 ac
- 1240 Pausch Rd
- 505 Lake Vista Way
- 405 Wolfpass Dr
- 640 Willowbrook Way
- 308 Orange Jewel Ct
- 641 Ambrose Dr
- 829 Bushwood Way
- 837 Bushwood Way
- 628 Middletown Ct
- 707 Bridgeway Dr
- 7006 Emerson
- 656 Tea Olive Blvd
- 801 Golden Bell
- 652 Tea Olive Blvd
- 504 Longfellow Dr
- 501 Longfellow Dr
- 0 Longfellow Dr Unit 3001735
- 0 Longfellow Dr Unit 20000648
- 517 Frost Ct
- 508 Longfellow Dr
- 521 Frost Ct
- 505 Longfellow Dr
- 525 Frost Ct
- 512 Longfellow Dr
- 513 Longfellow Dr
- 513 Frost Ct
- 529 Frost Ct
- 517 Longfellow Dr
- 509 Frost Ct
- 516 Longfellow Dr
- 1200 Waldman Ct
- 533 Frost Ct
- 512 Frost Ct
- 521 Longfellow Dr
Your Personal Tour Guide
Ask me questions while you tour the home.