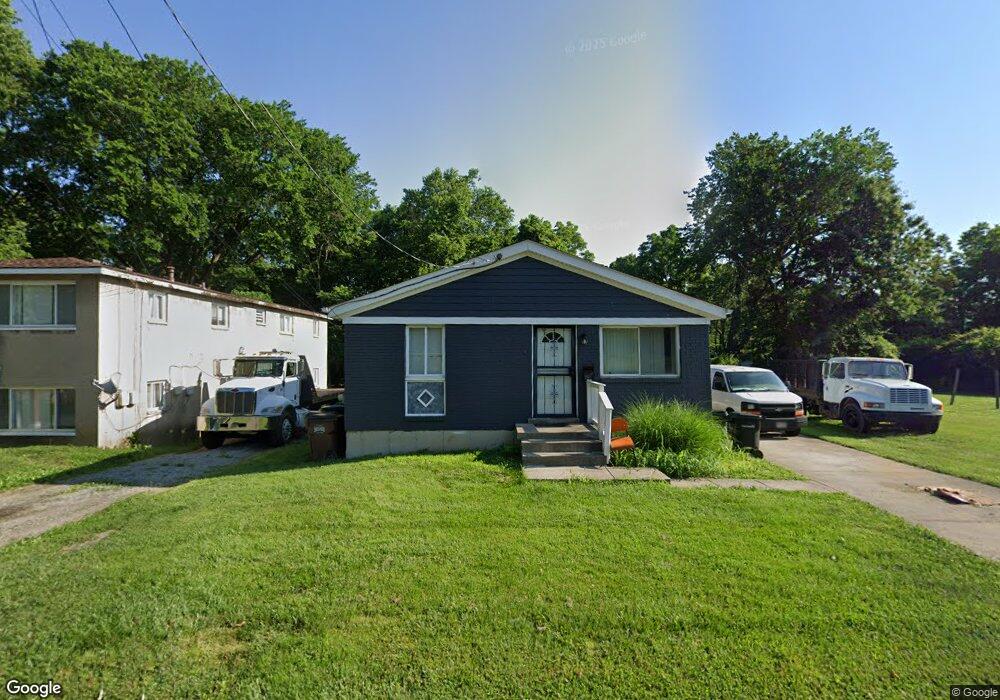
500 Matthews Dr Cincinnati, OH 45215
Estimated Value: $74,000 - $139,000
3
Beds
1
Bath
999
Sq Ft
$117/Sq Ft
Est. Value
About This Home
This home is located at 500 Matthews Dr, Cincinnati, OH 45215 and is currently estimated at $116,877, approximately $116 per square foot. 500 Matthews Dr is a home located in Hamilton County with nearby schools including Lincoln Heights Elementary School, Princeton Community Middle School, and Princeton High School.
Ownership History
Date
Name
Owned For
Owner Type
Purchase Details
Closed on
Dec 10, 2014
Sold by
Clark Gregory E
Bought by
Caver Williams Erie
Current Estimated Value
Purchase Details
Closed on
Sep 5, 2013
Sold by
Croxton Alice E
Bought by
Clark Gregory E
Purchase Details
Closed on
Jun 3, 2002
Sold by
Wells Fargo Bank Minnesota Na
Bought by
Croxton Alice E
Purchase Details
Closed on
Feb 8, 2002
Sold by
Brandi Lemon
Bought by
Wells Fargo Bank Minnesota Na and Delta Funding Home Equity Loan Tr 2000-1
Purchase Details
Closed on
Jul 12, 1999
Sold by
Brandi Lemon and Brandi Sheena
Bought by
Lemon Brandi
Home Financials for this Owner
Home Financials are based on the most recent Mortgage that was taken out on this home.
Original Mortgage
$29,400
Interest Rate
7.69%
Mortgage Type
Balloon
Purchase Details
Closed on
Jan 29, 1997
Sold by
Devine Gloria and Fishback Gloria
Bought by
Lemon Brandi and Dean Shenna
Purchase Details
Closed on
Jun 21, 1994
Sold by
Dean Otis
Bought by
Devine Gloria
Create a Home Valuation Report for This Property
The Home Valuation Report is an in-depth analysis detailing your home's value as well as a comparison with similar homes in the area
Home Values in the Area
Average Home Value in this Area
Purchase History
| Date | Buyer | Sale Price | Title Company |
|---|---|---|---|
| Caver Williams Erie | -- | None Available | |
| Clark Gregory E | $18,100 | Attorney | |
| Croxton Alice E | $19,700 | -- | |
| Wells Fargo Bank Minnesota Na | $32,000 | -- | |
| Lemon Brandi | -- | -- | |
| Lemon Brandi | -- | -- | |
| Devine Gloria | -- | -- |
Source: Public Records
Mortgage History
| Date | Status | Borrower | Loan Amount |
|---|---|---|---|
| Previous Owner | Lemon Brandi | $29,400 |
Source: Public Records
Tax History
| Year | Tax Paid | Tax Assessment Tax Assessment Total Assessment is a certain percentage of the fair market value that is determined by local assessors to be the total taxable value of land and additions on the property. | Land | Improvement |
|---|---|---|---|---|
| 2025 | $1,925 | $23,832 | $1,652 | $22,180 |
| 2024 | $1,644 | $23,832 | $1,652 | $22,180 |
| 2023 | $1,623 | $23,832 | $1,652 | $22,180 |
| 2022 | $1,158 | $11,088 | $1,652 | $9,436 |
| 2021 | $1,153 | $11,088 | $1,652 | $9,436 |
| 2020 | $1,145 | $11,088 | $1,652 | $9,436 |
| 2019 | $1,208 | $11,088 | $1,652 | $9,436 |
| 2018 | $1,170 | $11,088 | $1,652 | $9,436 |
| 2017 | $1,140 | $11,088 | $1,652 | $9,436 |
| 2016 | $1,090 | $12,128 | $2,097 | $10,031 |
| 2015 | $1,151 | $12,128 | $2,097 | $10,031 |
| 2014 | $1,156 | $12,128 | $2,097 | $10,031 |
| 2013 | $1,406 | $15,163 | $2,622 | $12,541 |
Source: Public Records
Map
Nearby Homes
- 10124 Chester Rd
- 502 Marion Rd
- 10136 Chester Rd
- 10167 Wayne Ave
- 10152 Chester Rd
- 1201 Dixie Ct
- 0 E Leslie Ave
- 1100 Timberland Dr
- 910 Byrd Ave
- 1723 Harmon Dr
- 1704 Harmon Dr
- 15 Bonham Rd
- 857 Steffen Ave
- 39 Rolling Hills Ct
- 1401 Chamberlain Ave
- 1076 Schumard Ave
- 26 Chestnut Ave
- 1239 Springfield Pike
- 10060 Ronnie Rd
- 51 Grove Rd
- 492 Matthews Dr
- 530 Matthews Dr
- 534 Matthews Dr
- 556 Matthews Dr
- 10008 Wayne Ave
- 10000 Wayne Ave
- 558 Matthews Dr
- 493 Matthews Dr
- 529 Matthews Dr
- 9996 Wayne Ave
- 535 Matthews Dr
- 572 Matthews Dr
- 584 Hope Ave
- 9986 Wayne Ave
- 10024 Wayne Ave
- 551 Matthews Dr
- 9988 Wayne Ave
- 584 Matthews Dr
- 9980 Wayne Ave
- 600 Matthews Dr
Your Personal Tour Guide
Ask me questions while you tour the home.