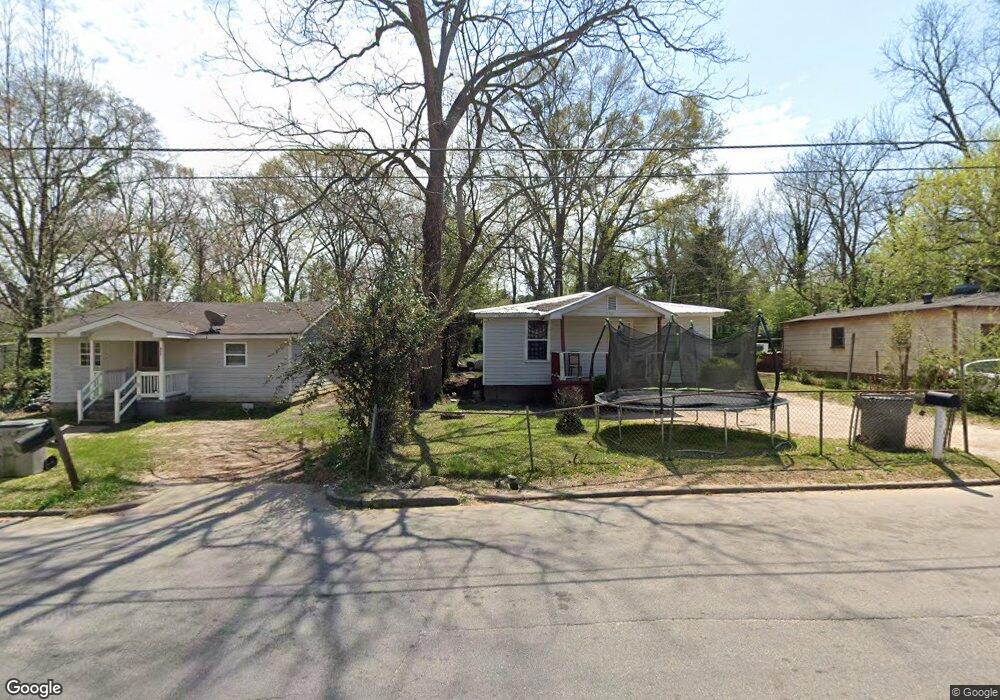
500 Mccall St Lagrange, GA 30241
Estimated Value: $37,000 - $107,000
2
Beds
1
Bath
928
Sq Ft
$85/Sq Ft
Est. Value
About This Home
This home is located at 500 Mccall St, Lagrange, GA 30241 and is currently estimated at $79,199, approximately $85 per square foot. 500 Mccall St is a home located in Troup County with nearby schools including Callaway Elementary School, Hogansville Elementary School, and Callaway Middle School.
Ownership History
Date
Name
Owned For
Owner Type
Purchase Details
Closed on
Sep 1, 1998
Sold by
Warner Bankston
Bought by
Bankston Warner and Toni Annette
Current Estimated Value
Purchase Details
Closed on
Oct 2, 1995
Sold by
Ina Coverson
Bought by
Warner Bankston
Purchase Details
Closed on
Oct 1, 1995
Sold by
Ovie Lee Truitt
Bought by
Ina Coverson
Purchase Details
Closed on
Nov 22, 1994
Sold by
Eula Hardy Jones
Bought by
Ovie Lee Truitt
Purchase Details
Closed on
Sep 10, 1994
Sold by
Catherine Moore Davis
Bought by
Eula Hardy Jones
Purchase Details
Closed on
Sep 9, 1994
Sold by
John Henry Moore
Bought by
Catherine Moore Davis
Purchase Details
Closed on
Sep 8, 1994
Sold by
Henry Moore
Bought by
John Henry Moore
Purchase Details
Closed on
Sep 1, 1994
Sold by
Robert T Willis
Bought by
Henry Moore
Purchase Details
Closed on
Jan 1, 1952
Sold by
Lula John and Lula Willis
Bought by
Robert T Willis
Create a Home Valuation Report for This Property
The Home Valuation Report is an in-depth analysis detailing your home's value as well as a comparison with similar homes in the area
Purchase History
| Date | Buyer | Sale Price | Title Company |
|---|---|---|---|
| Bankston Warner | -- | -- | |
| Warner Bankston | $5,000 | -- | |
| Ina Coverson | -- | -- | |
| Ovie Lee Truitt | -- | -- | |
| Eula Hardy Jones | -- | -- | |
| Catherine Moore Davis | -- | -- | |
| John Henry Moore | -- | -- | |
| Henry Moore | -- | -- | |
| Robert T Willis | -- | -- |
Source: Public Records
Tax History
| Year | Tax Paid | Tax Assessment Tax Assessment Total Assessment is a certain percentage of the fair market value that is determined by local assessors to be the total taxable value of land and additions on the property. | Land | Improvement |
|---|---|---|---|---|
| 2025 | $444 | $16,280 | $3,360 | $12,920 |
| 2024 | $412 | $15,120 | $3,360 | $11,760 |
| 2023 | $358 | $13,120 | $3,360 | $9,760 |
| 2022 | $351 | $12,560 | $3,360 | $9,200 |
| 2021 | $224 | $7,440 | $2,000 | $5,440 |
| 2020 | $181 | $7,440 | $2,000 | $5,440 |
| 2019 | $259 | $8,600 | $2,000 | $6,600 |
| 2018 | $259 | $8,600 | $2,000 | $6,600 |
| 2017 | $259 | $8,600 | $2,000 | $6,600 |
| 2016 | $259 | $8,572 | $2,000 | $6,572 |
| 2015 | $259 | $8,572 | $2,000 | $6,572 |
| 2014 | $249 | $8,226 | $2,000 | $6,226 |
| 2013 | -- | $8,756 | $2,000 | $6,756 |
Source: Public Records
Map
Nearby Homes
- 200 Mccall St
- 0 Brown St Unit 10550761
- 0 Brown St Unit 10550754
- 203 Revis St
- 205 Revis St
- 626 Smoot St
- 510 Smoot St
- 0 Burr St
- 306 Burr St
- 105 Dix St
- 0 Locust St
- 0 E Fendig St
- 113 E Fendig St
- 203 Fannin St
- 901 Whiteline St
- 303 E Mulberry St
- 109 Bell St
- 0 Kelley St Unit 10550311
- LOT 58 Belk St
- 119 Belk St
Your Personal Tour Guide
Ask me questions while you tour the home.