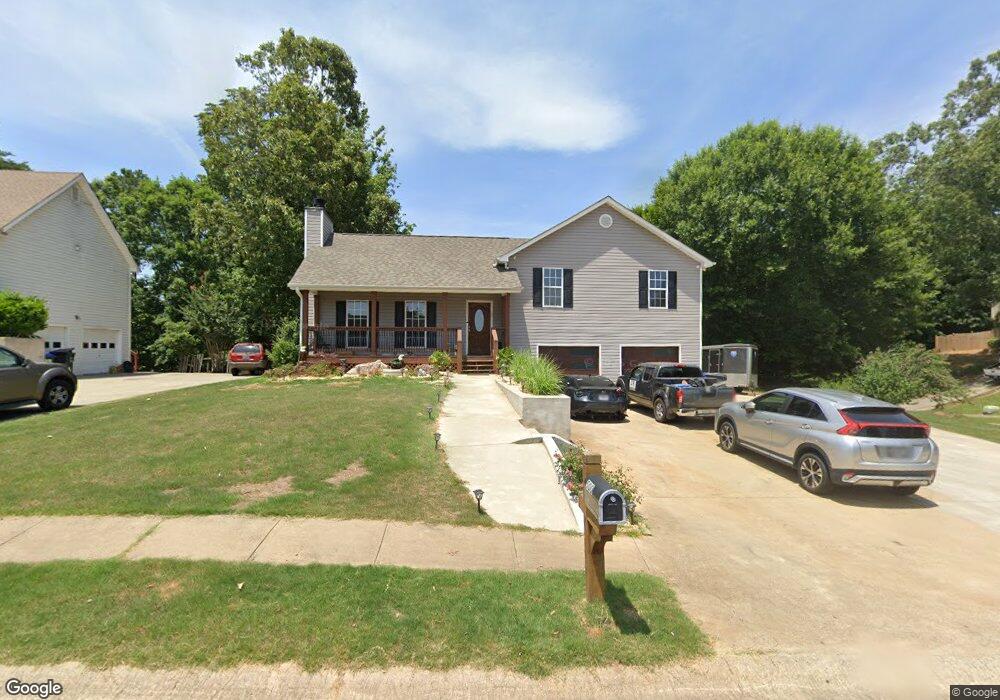
500 Misty Creek Unit 2 Canton, GA 30114
Estimated Value: $368,000
3
Beds
2
Baths
1,504
Sq Ft
$245/Sq Ft
Est. Value
About This Home
This home is located at 500 Misty Creek Unit 2, Canton, GA 30114 and is currently estimated at $368,000, approximately $244 per square foot. 500 Misty Creek Unit 2 is a home located in Cherokee County with nearby schools including J. Knox Elementary School, Teasley Middle School, and Cherokee High School.
Ownership History
Date
Name
Owned For
Owner Type
Purchase Details
Closed on
Jul 10, 2019
Sold by
Ruiz Hilaria
Bought by
Delgado Rigoberto R
Current Estimated Value
Purchase Details
Closed on
Feb 5, 2003
Sold by
Ruiz Hilaria
Bought by
Ruiz Hilaria
Home Financials for this Owner
Home Financials are based on the most recent Mortgage that was taken out on this home.
Original Mortgage
$123,500
Interest Rate
5.93%
Mortgage Type
New Conventional
Purchase Details
Closed on
Oct 30, 2000
Sold by
Skinner Billie J
Bought by
Garner William E
Home Financials for this Owner
Home Financials are based on the most recent Mortgage that was taken out on this home.
Original Mortgage
$124,969
Interest Rate
7.93%
Mortgage Type
FHA
Purchase Details
Closed on
Aug 21, 1998
Sold by
Valeri'S Custom Homes Inc
Bought by
Skinner Billie Jean
Create a Home Valuation Report for This Property
The Home Valuation Report is an in-depth analysis detailing your home's value as well as a comparison with similar homes in the area
Home Values in the Area
Average Home Value in this Area
Purchase History
| Date | Buyer | Sale Price | Title Company |
|---|---|---|---|
| Delgado Rigoberto R | -- | -- | |
| Ruiz Hilaria | -- | -- | |
| Ruiz Hilaria | $130,000 | -- | |
| Garner William E | $126,000 | -- | |
| Skinner Billie Jean | $107,500 | -- |
Source: Public Records
Mortgage History
| Date | Status | Borrower | Loan Amount |
|---|---|---|---|
| Previous Owner | Ruiz Hilaria | $123,500 | |
| Previous Owner | Garner William E | $124,969 |
Source: Public Records
Tax History Compared to Growth
Tax History
| Year | Tax Paid | Tax Assessment Tax Assessment Total Assessment is a certain percentage of the fair market value that is determined by local assessors to be the total taxable value of land and additions on the property. | Land | Improvement |
|---|---|---|---|---|
| 2025 | $3,389 | $117,800 | $26,000 | $91,800 |
| 2024 | $3,327 | $116,240 | $26,000 | $90,240 |
| 2023 | $3,313 | $115,760 | $26,000 | $89,760 |
| 2022 | $2,652 | $92,396 | $22,000 | $70,396 |
| 2021 | $2,194 | $71,956 | $15,680 | $56,276 |
| 2020 | $2,104 | $68,920 | $14,400 | $54,520 |
| 2019 | $1,982 | $64,880 | $14,400 | $50,480 |
| 2018 | $1,788 | $58,200 | $12,000 | $46,200 |
| 2017 | $1,328 | $141,500 | $12,000 | $44,600 |
| 2016 | $1,328 | $129,000 | $12,000 | $39,600 |
| 2015 | $1,222 | $117,700 | $11,200 | $35,880 |
| 2014 | $1,360 | $105,500 | $10,000 | $32,200 |
Source: Public Records
Map
Nearby Homes
- 791 Waleska Rd
- 0 Theodore Cox Cir Unit 7483543
- 264 Creek View Place
- 221 Creek View Place
- 232 Creek View Place
- 187 Belletta Dr
- 085 Belletta Dr
- 201 N Etowah Landing
- 560 Waleska Rd
- 70 Daisy Cir
- 550 Waleska Rd
- 80 Daisy Cir
- 125 Honey Dew Dr
- 122 Mashburn Place
- 100 Daisy Cir
- 0 Waleska Rd Unit 7600813
- 0 Waleska Rd Unit 10546832
- 30 Honey Dew Dr
- 450 Old Shoal Creek Rd
- 235 Riverstone Commons Cir
- 502 Misty Creek
- 1041 Whispering Woods Dr
- 1040 Whispering Woods Dr
- 1038 Whispering Woods Dr
- 1038 Whispering Woods Dr Unit 136
- 501 Misty Creek
- 504 Misty Creek
- 1042 Whispering Woods Dr
- 0 Whispering Woods Dr Unit 7763995-11608787
- 0 Whispering Woods Dr Unit 7705583-11489322
- 0 Whispering Woods Dr Unit 7555719-11287573
- 0 Whispering Woods Dr Unit 7316915-10991761
- 0 Whispering Woods Dr Unit 7331125-11010915
- 0 Whispering Woods Dr Unit 8824900
- 1036 Whispering Woods Dr
- 1043 Whispering Woods Dr Unit 3
- 503 Misty Creek
- 1044 Whispering Woods Dr
- 807 Deer Chase
- 1031 Whispering Woods Dr