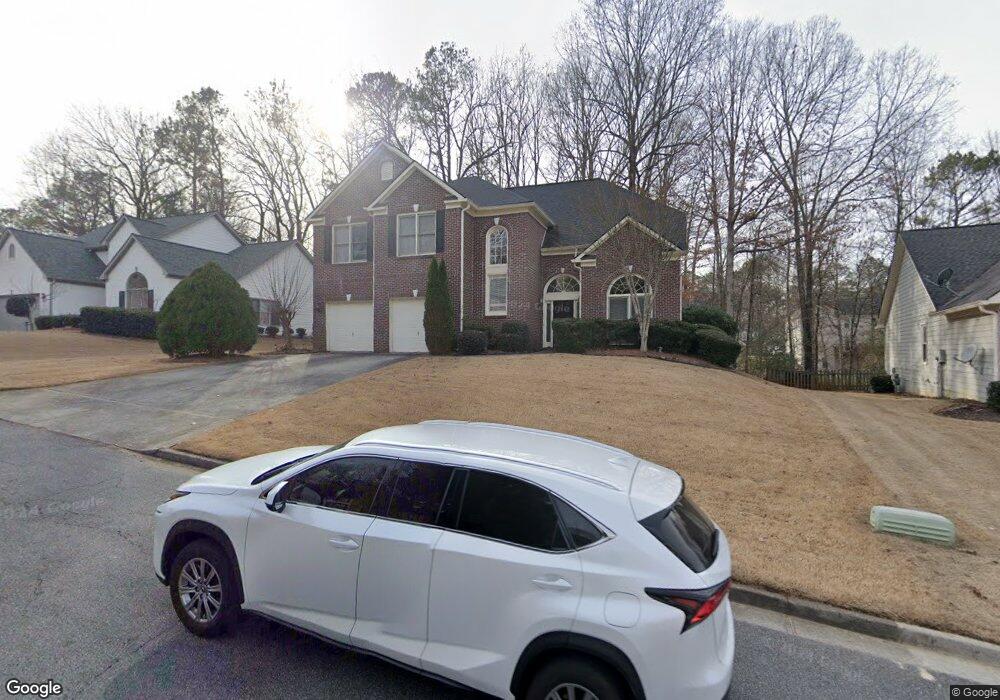
500 Morning Creek Ln Unit 3 Suwanee, GA 30024
Estimated Value: $543,552 - $606,000
4
Beds
3
Baths
2,607
Sq Ft
$219/Sq Ft
Est. Value
About This Home
This home is located at 500 Morning Creek Ln Unit 3, Suwanee, GA 30024 and is currently estimated at $570,638, approximately $218 per square foot. 500 Morning Creek Ln Unit 3 is a home located in Gwinnett County with nearby schools including Suwanee Elementary School, North Gwinnett Middle School, and North Gwinnett High School.
Ownership History
Date
Name
Owned For
Owner Type
Purchase Details
Closed on
Feb 22, 2022
Sold by
Robinson Denise R
Bought by
Kermali Rubab
Current Estimated Value
Purchase Details
Closed on
Feb 3, 2005
Sold by
Spung Royal A and Spung Dianna
Bought by
Buchanan Denise R
Home Financials for this Owner
Home Financials are based on the most recent Mortgage that was taken out on this home.
Original Mortgage
$34,500
Interest Rate
5.11%
Mortgage Type
Unknown
Purchase Details
Closed on
Oct 19, 1998
Sold by
The Ryland Grp Inc
Bought by
Spung Royal A and Spung Dianna M
Home Financials for this Owner
Home Financials are based on the most recent Mortgage that was taken out on this home.
Original Mortgage
$197,150
Interest Rate
6.61%
Mortgage Type
VA
Create a Home Valuation Report for This Property
The Home Valuation Report is an in-depth analysis detailing your home's value as well as a comparison with similar homes in the area
Home Values in the Area
Average Home Value in this Area
Purchase History
| Date | Buyer | Sale Price | Title Company |
|---|---|---|---|
| Kermali Rubab | $415,000 | -- | |
| Buchanan Denise R | $230,000 | -- | |
| Spung Royal A | $193,600 | -- |
Source: Public Records
Mortgage History
| Date | Status | Borrower | Loan Amount |
|---|---|---|---|
| Previous Owner | Buchanan Denise R | $34,500 | |
| Previous Owner | Buchanan Denise R | $184,000 | |
| Previous Owner | Spung Royal A | $197,150 |
Source: Public Records
Tax History Compared to Growth
Tax History
| Year | Tax Paid | Tax Assessment Tax Assessment Total Assessment is a certain percentage of the fair market value that is determined by local assessors to be the total taxable value of land and additions on the property. | Land | Improvement |
|---|---|---|---|---|
| 2025 | $8,113 | $221,280 | $44,080 | $177,200 |
| 2024 | $7,645 | $205,560 | $47,200 | $158,360 |
| 2023 | $7,645 | $196,280 | $47,200 | $149,080 |
| 2022 | $6,698 | $179,600 | $40,400 | $139,200 |
| 2021 | $5,063 | $131,400 | $29,720 | $101,680 |
| 2020 | $1,454 | $124,440 | $27,640 | $96,800 |
| 2019 | $3,771 | $114,000 | $32,000 | $82,000 |
| 2018 | $3,776 | $114,000 | $32,000 | $82,000 |
| 2016 | $3,591 | $104,480 | $28,000 | $76,480 |
| 2015 | $3,314 | $90,240 | $21,200 | $69,040 |
| 2014 | $3,543 | $90,240 | $21,200 | $69,040 |
Source: Public Records
Map
Nearby Homes
- 515 Morning Creek Ln
- 325 Morning Mist Walk Unit 2
- 3645 Hickory Branch Trail Unit 1
- 3540 Hickory Branch Trail
- 407 Vista Lake Dr
- 3612 Brookefall Ct
- 3713 Lake Edge Dr
- 189 Rutlidge Park Ln
- 3720 Brookefall Landing
- 347 Canterbury Place Dr
- 366 Regal Pines Ct
- 682 Montglade Ct Unit 1
- 4244 Austin Hills Dr
- 358 Rhodes House Ct
- 665 Roxford Ln Unit 3
- 3355 Smithtown Rd
- 115 Leaf Lake Dr
- 812 Holly Meadow Dr
- 500 Morning Creek Ln
- 490 Morning Creek Ln Unit 3
- 510 Morning Creek Ln
- 480 Morning Creek Ln Unit 3
- 3631 Morning Creek Ct
- 3621 Morning Creek Ct
- 520 Morning Creek Ln
- 505 Morning Creek Ln
- 3641 Morning Creek Ct
- 3611 Morning Creek Ct Unit 2
- 495 Morning Creek Ln Unit 3
- 470 Morning Creek Ln
- 470 Morning Creek Ln
- 535 Morning Creek Ln
- 3651 Morning Creek Ct
- 485 Morning Creek Ln Unit 3
- 3601 Morning Creek Ct Unit 24
- 3601 Morning Creek Ct
- 0 Morning Creek Unit 8951724
- 530 Morning Creek Ln Unit 3