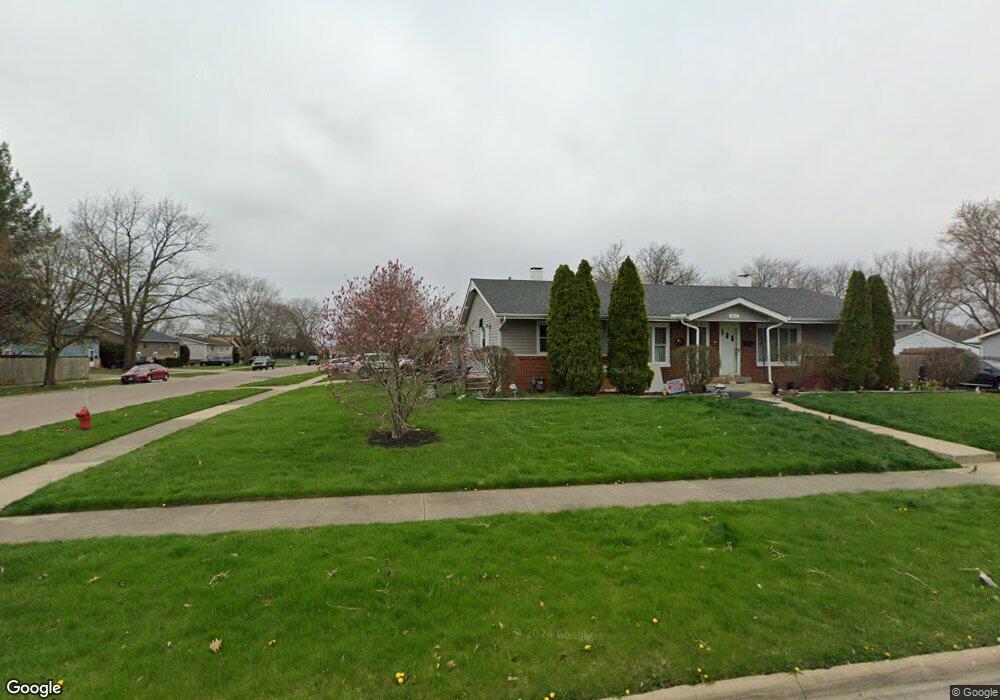
500 N Rosedale Ave Unit 502 Aurora, IL 60506
Edgelawn Randall NeighborhoodEstimated Value: $208,112 - $251,000
4
Beds
2
Baths
952
Sq Ft
$249/Sq Ft
Est. Value
About This Home
This home is located at 500 N Rosedale Ave Unit 502, Aurora, IL 60506 and is currently estimated at $236,778, approximately $248 per square foot. 500 N Rosedale Ave Unit 502 is a home located in Kane County with nearby schools including Mccleery Elementary School, Jefferson Middle School, and West Aurora High School.
Ownership History
Date
Name
Owned For
Owner Type
Purchase Details
Closed on
Dec 8, 2015
Sold by
Zuno Yolanda
Bought by
Monarrez Properties Llc
Current Estimated Value
Purchase Details
Closed on
Sep 22, 2014
Sold by
Monarrez Properties Llc
Bought by
Herrera Yolanda and Alanis Jessica
Purchase Details
Closed on
Nov 17, 2011
Sold by
Us Bank National Association
Bought by
Zuno Yolanda
Purchase Details
Closed on
Mar 14, 2011
Sold by
Doyens James C
Bought by
Us Bank National Association
Purchase Details
Closed on
Nov 26, 1999
Sold by
Doyens Paul F and Doyens Donna J
Bought by
Doyens James C
Home Financials for this Owner
Home Financials are based on the most recent Mortgage that was taken out on this home.
Original Mortgage
$123,400
Interest Rate
7.97%
Create a Home Valuation Report for This Property
The Home Valuation Report is an in-depth analysis detailing your home's value as well as a comparison with similar homes in the area
Home Values in the Area
Average Home Value in this Area
Purchase History
| Date | Buyer | Sale Price | Title Company |
|---|---|---|---|
| Monarrez Properties Llc | -- | First American Title Ins Co | |
| Herrera Yolanda | -- | None Available | |
| Zuno Yolanda | $88,000 | Premier Title | |
| Us Bank National Association | -- | Premier Title | |
| Doyens James C | $130,000 | Law Title Insurance Co Inc |
Source: Public Records
Mortgage History
| Date | Status | Borrower | Loan Amount |
|---|---|---|---|
| Previous Owner | Doyens James C | $123,400 |
Source: Public Records
Tax History Compared to Growth
Tax History
| Year | Tax Paid | Tax Assessment Tax Assessment Total Assessment is a certain percentage of the fair market value that is determined by local assessors to be the total taxable value of land and additions on the property. | Land | Improvement |
|---|---|---|---|---|
| 2024 | $4,346 | $54,890 | $5,548 | $49,342 |
| 2023 | $4,201 | $49,044 | $4,957 | $44,087 |
| 2022 | $3,813 | $43,072 | $4,523 | $38,549 |
| 2021 | $3,664 | $40,101 | $4,211 | $35,890 |
| 2020 | $3,487 | $37,247 | $3,911 | $33,336 |
| 2019 | $3,620 | $37,016 | $3,624 | $33,392 |
| 2018 | $3,292 | $32,976 | $3,352 | $29,624 |
| 2017 | $3,987 | $38,741 | $3,089 | $35,652 |
| 2016 | $3,637 | $34,238 | $2,648 | $31,590 |
| 2015 | -- | $29,064 | $2,277 | $26,787 |
| 2014 | -- | $26,967 | $2,093 | $24,874 |
| 2013 | -- | $27,459 | $2,063 | $25,396 |
Source: Public Records
Map
Nearby Homes
- 1735 Greene Ct
- 1751 Greene Ct
- 113 Stonewood Place Unit 6D
- 115 Hillwood Place Unit 4B
- 1730 W Galena Blvd Unit 402E
- 231 W Downer Place
- 833 N Randall Rd Unit C4
- 1389 Monomoy St Unit B2
- 2220 Mayflower Dr
- 972 Westgate Dr
- 1351 Monomoy St Unit D
- 149 S Gladstone Ave
- 164 S Calumet Ave
- 203 S Calumet Ave
- 1035 Newcastle Ln
- 1104 New Haven Ave
- 375 S Constitution Dr
- 381 S Constitution Dr
- 393 S Constitution Dr
- 405 S Constitution Dr
- 1723 Plum St Unit 2
- 512 N Rosedale Ave
- 1703 Plum St
- 1726 Rosedale Ct
- 1727 Plum St Unit 29
- 222 N Rosedale Ave
- 511 N Rosedale Ave
- 1701 Plum St
- 1735 Plum St Unit 37
- 1730 Rosedale Ct Unit 32
- 517 N Rosedale Ave
- 1730 Plum St
- 1706 Plum St
- 220 N Rosedale Ave
- 1738 Plum St Unit 1742
- 502 N Westlawn Ave
- 525 N Rosedale Ave Unit 4
- 508 N Westlawn Ave
- 221 N Rosedale Ave
- 1721 Rosedale Ct