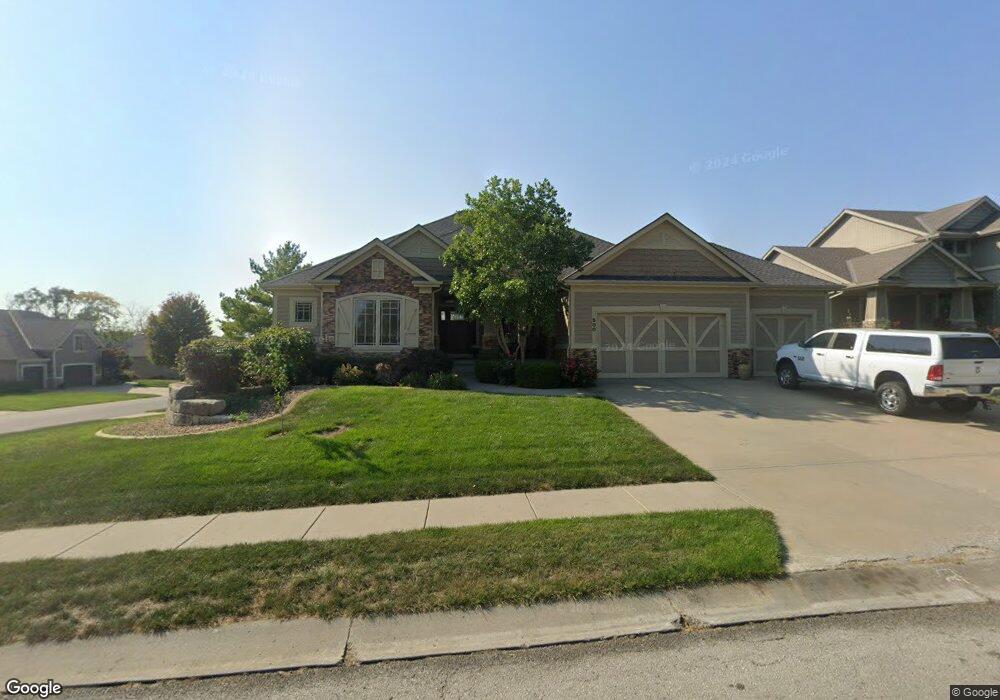
500 NE Spring Creek Place Lees Summit, MO 64086
Estimated Value: $514,872 - $665,000
About This Home
This home is located at 500 NE Spring Creek Place, Lees Summit, MO 64086 and is currently estimated at $582,218, approximately $227 per square foot. 500 NE Spring Creek Place is a home located in Jackson County with nearby schools including Richardson Elementary School, Bernard C. Campbell Middle School, and Lee's Summit North High School.
Ownership History
Purchase Details
Home Financials for this Owner
Home Financials are based on the most recent Mortgage that was taken out on this home.Purchase Details
Home Financials for this Owner
Home Financials are based on the most recent Mortgage that was taken out on this home.Home Values in the Area
Average Home Value in this Area
Purchase History
We collect this data history from publicly available records. To have your information removed, we recommend requesting removal directly through your county’s website.
| Date | Buyer | Sale Price | Title Company |
|---|---|---|---|
| Kliethermes Michael E | -- | Stewart Title Of Kansas City | |
| Summit Custom Homes Llc | -- | Stewart Title Of Kansas City |
Mortgage History
We collect this data history from publicly available records. To have your information removed, we recommend requesting removal directly through your county’s website.
| Date | Status | Borrower | Loan Amount |
|---|---|---|---|
| Open | Kliethermes Michael E | $235,000 | |
| Previous Owner | Summit Custom Homes Llc | $349,397 |
Tax History
| Year | Tax Paid | Tax Assessment Tax Assessment Total Assessment is a certain percentage of the fair market value that is determined by local assessors to be the total taxable value of land and additions on the property. | Land | Improvement |
|---|---|---|---|---|
| 2025 | $5,104 | $75,707 | $15,787 | $59,920 |
| 2024 | $5,066 | $70,680 | $11,210 | $59,470 |
| 2023 | $5,066 | $70,680 | $11,210 | $59,470 |
| 2022 | $6,288 | $77,900 | $10,583 | $67,317 |
| 2021 | $6,419 | $77,900 | $10,583 | $67,317 |
| 2020 | $6,061 | $72,846 | $10,583 | $62,263 |
| 2019 | $5,896 | $81,498 | $10,583 | $70,915 |
| 2018 | $1,672,816 | $70,930 | $9,211 | $61,719 |
| 2017 | $6,243 | $70,930 | $9,211 | $61,719 |
| 2016 | $6,243 | $70,851 | $11,951 | $58,900 |
| 2014 | $6,386 | $71,045 | $11,172 | $59,873 |
Map
- 416 NE Bitter Creek Rd
- 637 NE Sundance Trail
- 707 NE Sundance Trail
- 500 NE Woodpark Ln
- 2315 NE Smokey Hill Dr
- 212 SE Bingham Dr
- 709 NE Twin Brook Dr
- 405 NE Woodpark Ln
- 516 NE Topaz Dr
- 108 NE Topaz Dr
- 204 SE Carolina Dr
- 2910 NE Viewpark Place
- 125 SE Battery Point
- 2134 NE Belvoir St
- 325 SE Canterbury Ln
- 2204 NE Chipman Rd
- 2113 SE 2nd Terrace
- 2405 NE Carousel Cir
- 203 NE Crescent St
- 12406 S Acacia Dr
- 2517 NE Spring Creek Dr
- 504 NE Spring Creek Place
- 2508 NE Spring Creek Dr
- 2521 NE Spring Creek Dr
- 2513 NE Spring Creek Dr
- 501 NE Spring Creek Place
- 2509 NE Spring Creek Dr
- 505 NE Spring Creek Place
- 508 NE Spring Creek Place
- 2504 NE Spring Creek Dr
- 2525 NE Spring Creek Dr
- 2521 NE Bitter Creek Ct
- 509 NE Spring Creek Place
- 2505 NE Spring Creek Dr
- 2540 NE Willow Creek Ln
- 2500 NE Spring Creek Dr
- 2520 NE Bitter Creek Ct
- 2532 NE Willow Creek Ln
- 513 NE Spring Creek Place
- 2501 NE Spring Creek Dr
Ask me questions while you tour the home.