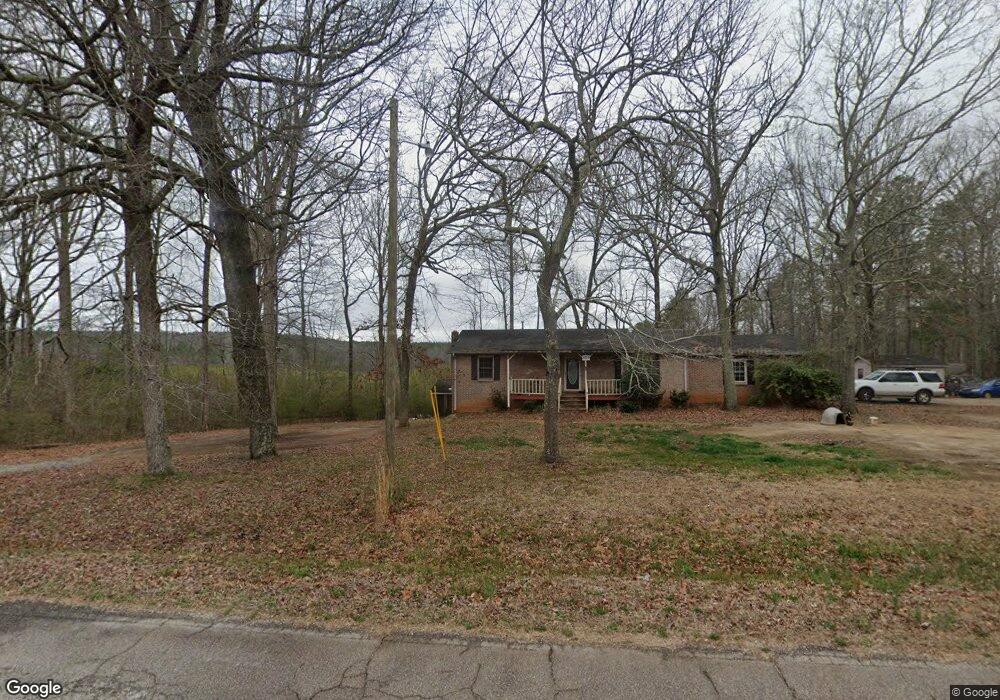
500 Old Corinth Rd Buchanan, GA 30113
Estimated Value: $74,000 - $272,000
6
Beds
3
Baths
2,392
Sq Ft
$85/Sq Ft
Est. Value
About This Home
This home is located at 500 Old Corinth Rd, Buchanan, GA 30113 and is currently estimated at $204,176, approximately $85 per square foot. 500 Old Corinth Rd is a home located in Haralson County with nearby schools including Haralson County High School.
Ownership History
Date
Name
Owned For
Owner Type
Purchase Details
Closed on
Aug 22, 2025
Sold by
Gentry Lamar C
Bought by
Oneal Parker William and Duncan Mary Catilin
Current Estimated Value
Purchase Details
Closed on
Oct 23, 2006
Sold by
Not Provided
Bought by
Gentry Lamar C and Gentry Martha C
Home Financials for this Owner
Home Financials are based on the most recent Mortgage that was taken out on this home.
Original Mortgage
$90,000
Interest Rate
6.31%
Mortgage Type
New Conventional
Purchase Details
Closed on
Jan 6, 2005
Sold by
Cruse Clifford By Cruse Guy and Cruse Edw
Bought by
Gentry Martha Cruse
Purchase Details
Closed on
Jan 4, 2005
Sold by
Edwards Pamela Y
Bought by
Gentry Martha Cruse
Purchase Details
Closed on
Dec 20, 2004
Sold by
Corbett Donna
Bought by
Gentry Martha Cruse
Purchase Details
Closed on
Dec 17, 2004
Sold by
Rakoski Robbie
Bought by
Gentry Martha Cruse
Purchase Details
Closed on
Aug 28, 1995
Sold by
Smith Benetta and Smith Jose
Bought by
Cruse C E
Purchase Details
Closed on
Sep 16, 1994
Bought by
Smith Benetta and Smith Jose
Create a Home Valuation Report for This Property
The Home Valuation Report is an in-depth analysis detailing your home's value as well as a comparison with similar homes in the area
Home Values in the Area
Average Home Value in this Area
Purchase History
| Date | Buyer | Sale Price | Title Company |
|---|---|---|---|
| Oneal Parker William | $75,000 | -- | |
| Gentry Lamar C | -- | -- | |
| Gentry Martha Cruse | -- | -- | |
| Gentry Martha Cruse | -- | -- | |
| Gentry Martha Cruse | -- | -- | |
| Gentry Martha Cruse | -- | -- | |
| Gentry Martha Cruse | -- | -- | |
| Gentry Martha Cruse | -- | -- | |
| Gentry Martha Cruse | -- | -- | |
| Gentry Martha Cruse | -- | -- | |
| Gentry Martha Cruse | -- | -- | |
| Cruse C E | $2,000 | -- | |
| Smith Benetta | -- | -- |
Source: Public Records
Mortgage History
| Date | Status | Borrower | Loan Amount |
|---|---|---|---|
| Previous Owner | Gentry Lamar C | $90,000 |
Source: Public Records
Tax History Compared to Growth
Tax History
| Year | Tax Paid | Tax Assessment Tax Assessment Total Assessment is a certain percentage of the fair market value that is determined by local assessors to be the total taxable value of land and additions on the property. | Land | Improvement |
|---|---|---|---|---|
| 2024 | $1,746 | $67,330 | $3,400 | $63,930 |
| 2023 | $1,891 | $70,516 | $3,400 | $67,116 |
| 2022 | $1,532 | $57,143 | $3,400 | $53,743 |
| 2021 | $1,520 | $54,398 | $3,400 | $50,998 |
| 2020 | $1,547 | $55,130 | $3,400 | $51,730 |
| 2019 | $1,541 | $52,884 | $3,400 | $49,484 |
| 2018 | $1,563 | $52,884 | $3,400 | $49,484 |
| 2017 | $1,454 | $44,718 | $3,400 | $41,318 |
| 2016 | $1,163 | $37,969 | $3,400 | $34,569 |
| 2015 | $1,174 | $38,302 | $3,400 | $34,903 |
| 2014 | $1,187 | $39,320 | $3,400 | $35,920 |
Source: Public Records
Map
Nearby Homes
- 112 Brannon Rd
- 340 Loftis Rd
- 1225 Coppermine Rd
- 00 Coppermine Rd
- 211 Loftis Rd
- 71 Friendship Church Rd
- 300 Speight Rd
- 2930 N Highway 113
- 191 True Gospel Rd
- 991 Waddell Rd
- 818 Corinth Five Points Rd
- 2404 Corinth Poseyville Rd
- 0 Hutcheson Rd Unit 10474278
- 0 Hutcheson Rd Unit 7537190
- 5960 Georgia Highway 120
- 2895 Morgan Rd
- 0 Hamrick Rd Unit 25461822
- TBD Hamrick Rd
- 458 Old Corinth Rd
- 501 Old Corinth Rd
- 491 Old Corinth Rd
- 542 Old Corinth Rd
- 544 Old Corinth Rd
- 515 Old Corinth Rd
- 481 Old Corinth Rd
- 540 Old Corinth Rd
- 469 Old Corinth Rd
- 556 Old Corinth Rd
- 453 Old Corinth Rd
- 653 Old Corinth Rd
- 450 Old Corinth Rd
- 547 Old Corinth Rd
- 8222 Georgia Hwy 120
- 433 Old Corinth Rd
- 7490 Georgia Highway 120
- 7470 Georgia Highway 120
- 568 Old Corinth Rd
- 557 Old Corinth Rd