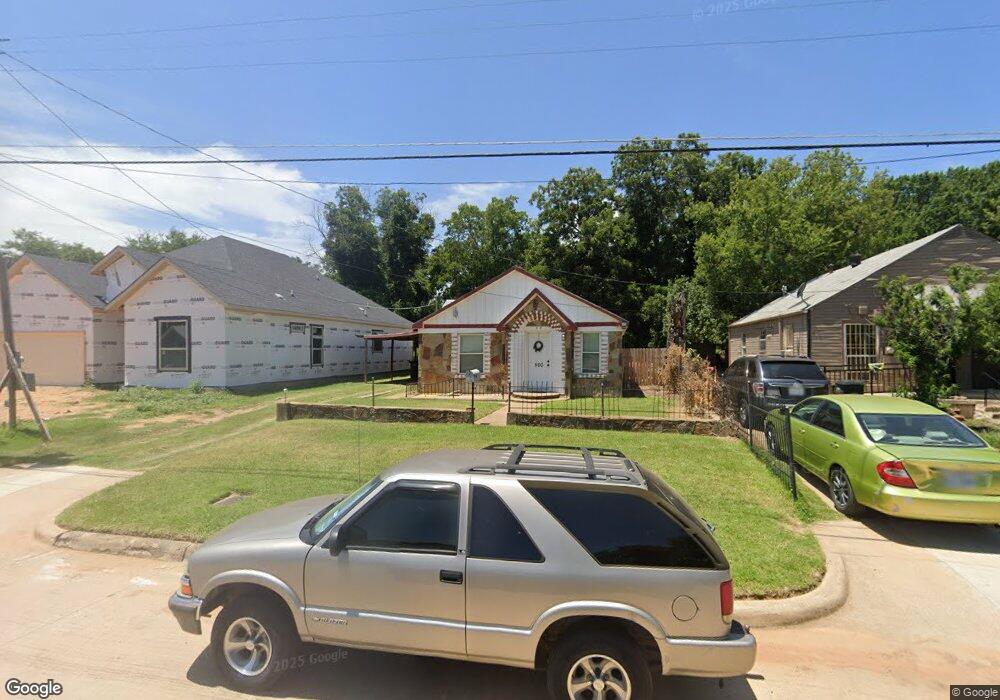
500 Paradise St Fort Worth, TX 76111
United Riverside NeighborhoodEstimated Value: $189,369 - $269,000
3
Beds
2
Baths
934
Sq Ft
$247/Sq Ft
Est. Value
About This Home
This home is located at 500 Paradise St, Fort Worth, TX 76111 and is currently estimated at $230,842, approximately $247 per square foot. 500 Paradise St is a home located in Tarrant County with nearby schools including Versia Williams Elementary School, Riverside Middle School, and Carter-Riverside High School.
Ownership History
Date
Name
Owned For
Owner Type
Purchase Details
Closed on
Nov 8, 2010
Sold by
W W Entities Llc
Bought by
Blank Kathleen S
Current Estimated Value
Purchase Details
Closed on
Mar 18, 2008
Sold by
Citifinancial Mortgage Co Inc
Bought by
W W Entities Llc
Purchase Details
Closed on
Feb 5, 2008
Sold by
Flores Refugia
Bought by
Citifinancial Mortgage Co Inc
Purchase Details
Closed on
Nov 24, 1997
Sold by
Casa Caramba
Bought by
Flores Refugia
Home Financials for this Owner
Home Financials are based on the most recent Mortgage that was taken out on this home.
Original Mortgage
$26,700
Interest Rate
7.3%
Mortgage Type
Seller Take Back
Purchase Details
Closed on
Apr 9, 1997
Sold by
Chatman Johnson Eunice and Smith Eula M
Bought by
Planet Investments
Home Financials for this Owner
Home Financials are based on the most recent Mortgage that was taken out on this home.
Original Mortgage
$23,000
Interest Rate
7.92%
Create a Home Valuation Report for This Property
The Home Valuation Report is an in-depth analysis detailing your home's value as well as a comparison with similar homes in the area
Home Values in the Area
Average Home Value in this Area
Purchase History
| Date | Buyer | Sale Price | Title Company |
|---|---|---|---|
| Blank Kathleen S | -- | None Available | |
| W W Entities Llc | -- | First American Title Co | |
| Citifinancial Mortgage Co Inc | $25,569 | None Available | |
| Flores Refugia | -- | Safeco Land Title Co | |
| Planet Investments | -- | Safeco Land Title |
Source: Public Records
Mortgage History
| Date | Status | Borrower | Loan Amount |
|---|---|---|---|
| Previous Owner | Flores Refugia | $26,700 | |
| Previous Owner | Planet Investments | $23,000 |
Source: Public Records
Tax History Compared to Growth
Tax History
| Year | Tax Paid | Tax Assessment Tax Assessment Total Assessment is a certain percentage of the fair market value that is determined by local assessors to be the total taxable value of land and additions on the property. | Land | Improvement |
|---|---|---|---|---|
| 2025 | $131 | $172,222 | $25,000 | $147,222 |
| 2024 | $131 | $172,222 | $25,000 | $147,222 |
| 2023 | $2,037 | $163,892 | $25,000 | $138,892 |
| 2022 | $2,128 | $131,674 | $17,500 | $114,174 |
| 2021 | $2,041 | $107,581 | $14,000 | $93,581 |
| 2020 | $1,790 | $96,035 | $14,000 | $82,035 |
| 2019 | $1,692 | $96,809 | $14,000 | $82,809 |
| 2018 | $1,112 | $55,902 | $7,000 | $48,902 |
| 2017 | $1,440 | $64,264 | $7,000 | $57,264 |
| 2016 | $1,309 | $54,149 | $7,000 | $47,149 |
| 2015 | $922 | $42,000 | $7,700 | $34,300 |
| 2014 | $922 | $42,000 | $7,700 | $34,300 |
Source: Public Records
Map
Nearby Homes
- 513 S Sylvania Ave
- 510 Paradise St
- 600 Paradise St
- 461 Rayner Ave
- 421 S Rayner St
- 412 Vista Buena Trail
- 408 Vista Buena Trail
- 404 Vista Buena Trail
- 400 Vista Buena Trail
- 2716 E 12th St
- 2915 Lasalle St
- 2700 Finley St
- 2751 E 1st St
- 109 S Judkins St
- 3109 E 12th St
- 3105 Finley St
- 2921 E 1st St
- 301 N Chandler Dr
- 308 N Retta St
- 317 N Chandler Dr
- 420 Paradise St
- 504 Paradise St
- 416 Paradise St
- 506 Paradise St
- 513 Paradise St
- 412 Paradise St
- 509 S Sylvania Ave
- 415 Paradise St
- 2704 Lawnwood St
- 413 Paradise St
- 518 Paradise St
- 511 S Sylvania Ave
- 2708 Lawnwood St
- 517 S Sylvania Ave
- 2622 Galvez Ave
- 2620 Galvez Ave
- 2618 Galvez Ave
- 2712 Lawnwood St
- 2700 Galvez Ave
- 519 S Sylvania Ave