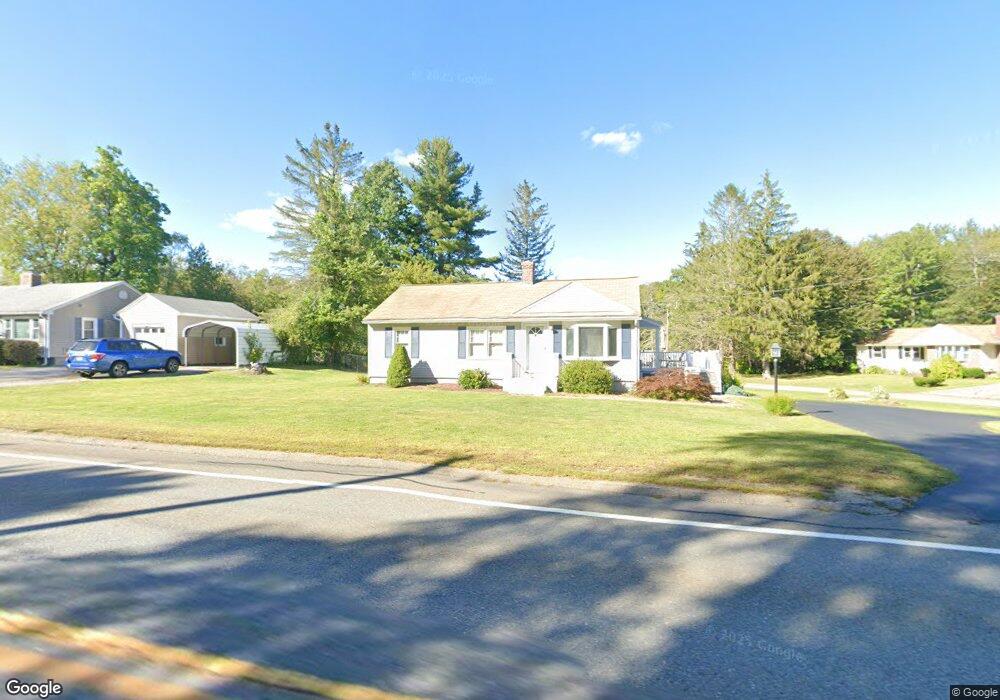
500 Pleasant St Paxton, MA 01612
Estimated Value: $356,000 - $433,000
3
Beds
2
Baths
912
Sq Ft
$431/Sq Ft
Est. Value
About This Home
This home is located at 500 Pleasant St, Paxton, MA 01612 and is currently estimated at $392,664, approximately $430 per square foot. 500 Pleasant St is a home located in Worcester County with nearby schools including Wachusett Regional High School and Worcester Seventh-Day Adventist School.
Ownership History
Date
Name
Owned For
Owner Type
Purchase Details
Closed on
Mar 24, 2025
Sold by
Pepin John E and Pepin Linda J
Bought by
Linda J Pepin Lt and Pepin
Current Estimated Value
Purchase Details
Closed on
Mar 14, 1989
Sold by
Gray Jon D
Bought by
Pepin John E
Home Financials for this Owner
Home Financials are based on the most recent Mortgage that was taken out on this home.
Original Mortgage
$102,000
Interest Rate
10.55%
Mortgage Type
Purchase Money Mortgage
Purchase Details
Closed on
May 19, 1987
Sold by
Scholten Deborah G
Bought by
Gray Jon D
Create a Home Valuation Report for This Property
The Home Valuation Report is an in-depth analysis detailing your home's value as well as a comparison with similar homes in the area
Home Values in the Area
Average Home Value in this Area
Purchase History
| Date | Buyer | Sale Price | Title Company |
|---|---|---|---|
| Linda J Pepin Lt | -- | None Available | |
| Linda J Pepin Lt | -- | None Available | |
| Pepin John E | $118,900 | -- | |
| Pepin John E | $118,900 | -- | |
| Gray Jon D | $106,000 | -- |
Source: Public Records
Mortgage History
| Date | Status | Borrower | Loan Amount |
|---|---|---|---|
| Previous Owner | Gray Jon D | $55,000 | |
| Previous Owner | Gray Jon D | $89,600 | |
| Previous Owner | Gray Jon D | $102,000 |
Source: Public Records
Tax History Compared to Growth
Tax History
| Year | Tax Paid | Tax Assessment Tax Assessment Total Assessment is a certain percentage of the fair market value that is determined by local assessors to be the total taxable value of land and additions on the property. | Land | Improvement |
|---|---|---|---|---|
| 2025 | $4,885 | $331,400 | $97,500 | $233,900 |
| 2024 | $5,271 | $328,000 | $97,500 | $230,500 |
| 2023 | $5,302 | $301,600 | $88,600 | $213,000 |
| 2022 | $5,064 | $266,800 | $88,600 | $178,200 |
| 2021 | $4,579 | $232,100 | $80,700 | $151,400 |
| 2020 | $10,394 | $219,400 | $72,100 | $147,300 |
| 2019 | $4,201 | $212,800 | $65,500 | $147,300 |
| 2018 | $9,495 | $189,000 | $62,400 | $126,600 |
| 2017 | $3,580 | $175,600 | $59,500 | $116,100 |
| 2016 | $3,296 | $160,100 | $59,500 | $100,600 |
| 2015 | $3,071 | $147,700 | $59,500 | $88,200 |
| 2014 | $2,984 | $145,500 | $59,500 | $86,000 |
Source: Public Records
Map
Nearby Homes