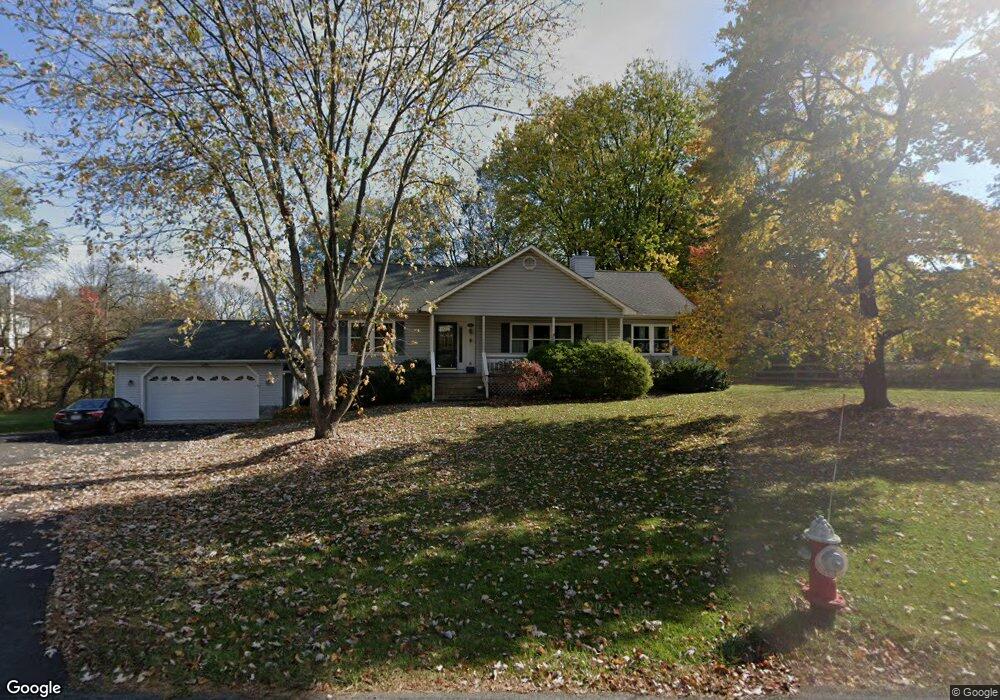
500 S 9th St Purcellville, VA 20132
Estimated Value: $597,000 - $699,000
--
Bed
3
Baths
1,568
Sq Ft
$427/Sq Ft
Est. Value
About This Home
This home is located at 500 S 9th St, Purcellville, VA 20132 and is currently estimated at $669,540, approximately $427 per square foot. 500 S 9th St is a home located in Loudoun County with nearby schools including Emerick Elementary School, Blue Ridge Middle School, and Loudoun Valley High School.
Ownership History
Date
Name
Owned For
Owner Type
Purchase Details
Closed on
Oct 30, 2001
Sold by
Timbers Kenneth M
Bought by
Walsh Patrick M
Current Estimated Value
Home Financials for this Owner
Home Financials are based on the most recent Mortgage that was taken out on this home.
Original Mortgage
$216,000
Outstanding Balance
$85,045
Interest Rate
6.82%
Estimated Equity
$584,495
Purchase Details
Closed on
Oct 29, 1999
Sold by
Tranten Michael S
Bought by
Timbers Kenneth M
Home Financials for this Owner
Home Financials are based on the most recent Mortgage that was taken out on this home.
Original Mortgage
$188,500
Interest Rate
7.78%
Purchase Details
Closed on
May 29, 1998
Sold by
Davis Gregory R and Davis Jennifer M
Bought by
Tranten Michael S and Tranten Pamela M
Home Financials for this Owner
Home Financials are based on the most recent Mortgage that was taken out on this home.
Original Mortgage
$168,800
Interest Rate
7.12%
Mortgage Type
VA
Purchase Details
Closed on
Nov 12, 1993
Sold by
Mh Davis
Bought by
Hoopengardner Lori G
Create a Home Valuation Report for This Property
The Home Valuation Report is an in-depth analysis detailing your home's value as well as a comparison with similar homes in the area
Home Values in the Area
Average Home Value in this Area
Purchase History
| Date | Buyer | Sale Price | Title Company |
|---|---|---|---|
| Walsh Patrick M | $270,000 | -- | |
| Timbers Kenneth M | $188,500 | -- | |
| Tranten Michael S | $165,500 | -- | |
| Hoopengardner Lori G | $123,000 | -- |
Source: Public Records
Mortgage History
| Date | Status | Borrower | Loan Amount |
|---|---|---|---|
| Open | Walsh Patrick M | $216,000 | |
| Previous Owner | Timbers Kenneth M | $188,500 | |
| Previous Owner | Hoopengardner Lori G | $168,800 |
Source: Public Records
Tax History Compared to Growth
Tax History
| Year | Tax Paid | Tax Assessment Tax Assessment Total Assessment is a certain percentage of the fair market value that is determined by local assessors to be the total taxable value of land and additions on the property. | Land | Improvement |
|---|---|---|---|---|
| 2025 | $5,410 | $647,880 | $224,000 | $423,880 |
| 2024 | $5,484 | $612,750 | $224,000 | $388,750 |
| 2023 | $5,234 | $598,130 | $224,000 | $374,130 |
| 2022 | $4,547 | $510,850 | $187,300 | $323,550 |
| 2021 | $4,604 | $469,830 | $147,300 | $322,530 |
| 2020 | $4,898 | $473,200 | $147,300 | $325,900 |
| 2019 | $4,594 | $439,600 | $137,300 | $302,300 |
| 2018 | $4,693 | $432,490 | $137,300 | $295,190 |
| 2017 | $4,659 | $414,120 | $137,300 | $276,820 |
| 2016 | $4,648 | $405,970 | $0 | $0 |
| 2015 | $4,384 | $248,990 | $0 | $248,990 |
| 2014 | $3,930 | $212,980 | $0 | $212,980 |
Source: Public Records
Map
Nearby Homes
- 115 Frazer Dr
- 113 Frazer Dr
- 609 S Maple Ave
- 221 S Maple Ave
- 14649 Fordson Ct
- 14691 Fordson Ct
- 14629 Fordson Ct
- 648 Elliot Dr
- 17443 Aldershot Place
- 37517 Bernardini Ct
- 17431 Aldershot Place
- 116 Desales Dr
- 3 Springbury Dr
- 109 Amalfi Ct
- 485 Wordsworth Cir
- The Ashton I Plan at Valley Springs Estates
- The Ashton II Plan at Valley Springs Estates
- The Oakhall Plan at Valley Springs Estates
- The Elmsgate Plan at Valley Springs Estates
- 420 S 20th St