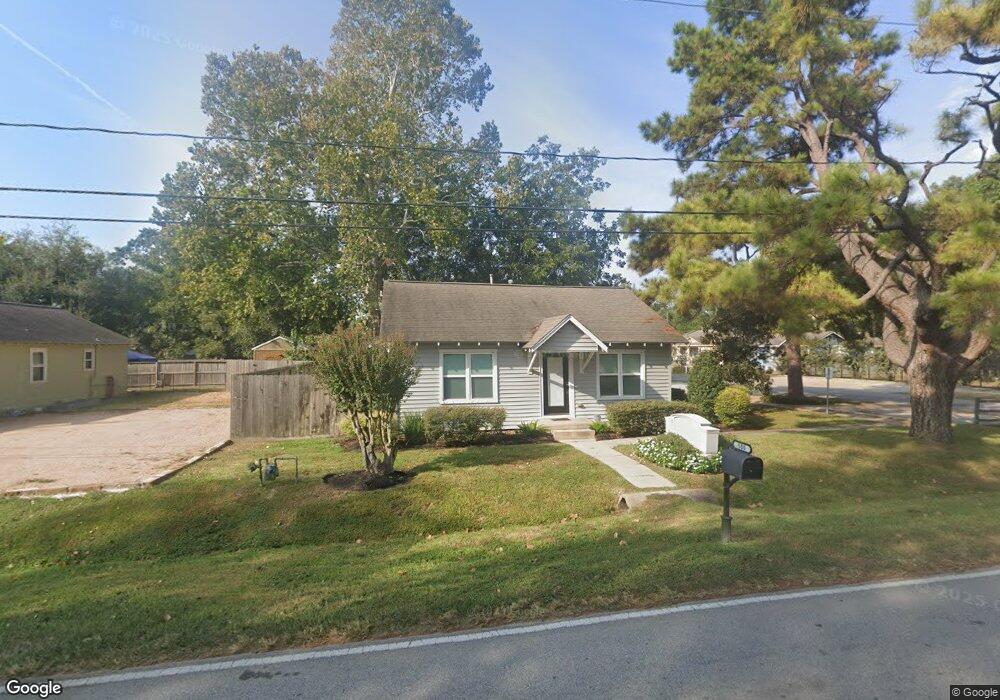
500 S Cherry St Tomball, TX 77375
Estimated Value: $257,000 - $302,000
2
Beds
1
Bath
1,550
Sq Ft
$177/Sq Ft
Est. Value
About This Home
This home is located at 500 S Cherry St, Tomball, TX 77375 and is currently estimated at $274,892, approximately $177 per square foot. 500 S Cherry St is a home located in Harris County with nearby schools including Tomball Elementary School, Tomball Intermediate School, and Tomball Junior High School.
Ownership History
Date
Name
Owned For
Owner Type
Purchase Details
Closed on
Nov 21, 2024
Sold by
Whitworth Stephen and Whitworth Cathy
Bought by
Stephen T Whitworth And Cathy L Whitworth Liv and Whitworth
Current Estimated Value
Purchase Details
Closed on
Dec 30, 2014
Sold by
Dunaway Buz and Dunaway J A
Bought by
Whitworth Stephen and Whitworth Cathy
Purchase Details
Closed on
Mar 29, 1999
Sold by
Dale Rebecca Ann and Mcadams Garrott B
Bought by
Scarborough Michael and Scarbobrough Janet
Home Financials for this Owner
Home Financials are based on the most recent Mortgage that was taken out on this home.
Original Mortgage
$44,000
Interest Rate
6.82%
Purchase Details
Closed on
Aug 23, 1995
Sold by
Baer Douglas E
Bought by
Dale Becky
Create a Home Valuation Report for This Property
The Home Valuation Report is an in-depth analysis detailing your home's value as well as a comparison with similar homes in the area
Home Values in the Area
Average Home Value in this Area
Purchase History
| Date | Buyer | Sale Price | Title Company |
|---|---|---|---|
| Stephen T Whitworth And Cathy L Whitworth Liv | -- | None Listed On Document | |
| Stephen T Whitworth And Cathy L Whitworth Liv | -- | None Listed On Document | |
| Whitworth Stephen | -- | North American Title Co | |
| Scarborough Michael | -- | Alamo Title 50 | |
| Dale Becky | -- | -- |
Source: Public Records
Mortgage History
| Date | Status | Borrower | Loan Amount |
|---|---|---|---|
| Previous Owner | Scarborough Michael | $44,000 |
Source: Public Records
Tax History
| Year | Tax Paid | Tax Assessment Tax Assessment Total Assessment is a certain percentage of the fair market value that is determined by local assessors to be the total taxable value of land and additions on the property. | Land | Improvement |
|---|---|---|---|---|
| 2025 | $5,230 | $231,890 | $105,000 | $126,890 |
| 2024 | $5,230 | $236,300 | $98,000 | $138,300 |
| 2023 | $5,230 | $215,450 | $79,934 | $135,516 |
| 2022 | $3,607 | $160,000 | $59,951 | $100,049 |
| 2021 | $3,076 | $129,700 | $43,298 | $86,402 |
| 2020 | $3,365 | $137,192 | $33,306 | $103,886 |
| 2019 | $2,996 | $118,774 | $26,645 | $92,129 |
| 2018 | $1,821 | $135,867 | $26,645 | $109,222 |
| 2017 | $3,315 | $131,553 | $26,645 | $104,908 |
| 2016 | $3,062 | $121,511 | $26,645 | $94,866 |
| 2015 | $1,308 | $117,376 | $26,645 | $90,731 |
| 2014 | $1,308 | $96,402 | $26,645 | $69,757 |
Source: Public Records
Map
Nearby Homes
- 109 Mcphail St
- 200 S Cherry St
- 504 Percival St Unit A
- 508 Clarence St
- TBD Clayton St
- 18818 Cornelia Fields Ln
- 18723 Buttercup Farms Ln
- 19935 Epona Creek Dr
- 18707 Buttercup Farms Ln
- 18826 Cornelia Fields Ln
- 614 Percival St
- 702 Clayton St
- 701 Malone St
- 0 N Sycamore St
- 712 Clarence St
- TBD Mechanic St
- 0 Holiday St
- lt 19 Mechanic Rd
- 429 Ash St
- 214 Texas St
- 504 S Cherry St
- 307 Florence St
- 211 Florence St
- 304 Florence St
- 306 Florence St
- 506 S Cherry St
- 308 Florence St
- 208 Mcphail St
- 210 Florence St
- 311 Florence St
- 207 Florence St
- 206 Mcphail St
- 310 Florence St
- 310 & 312 Florence St
- 316 Mcphail St
- 206 Florence St
- 312 Florence St
- 204 Mcphail St
- 21827 White Oak View Dr
- 509 S Oak St
Your Personal Tour Guide
Ask me questions while you tour the home.