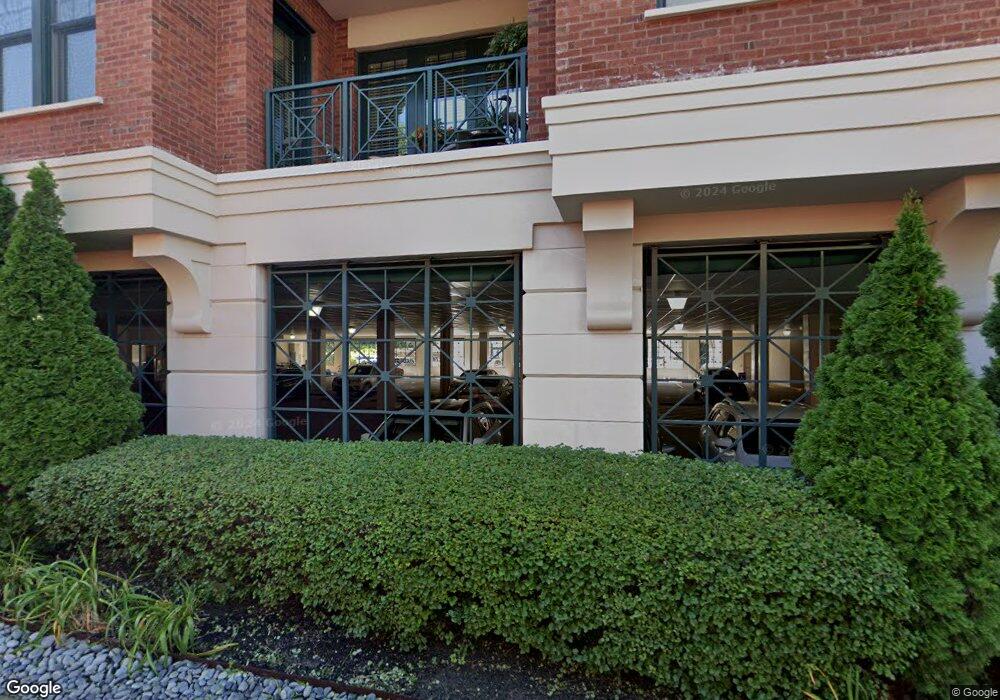
500 S Parkview Ave Unit 400 Columbus, OH 43209
Estimated Value: $860,000
--
Bed
--
Bath
--
Sq Ft
0.44
Acres
About This Home
This home is located at 500 S Parkview Ave Unit 400, Columbus, OH 43209 and is currently priced at $860,000. 500 S Parkview Ave Unit 400 is a home located in Franklin County with nearby schools including Cassingham Elementary School, Bexley Middle School, and Bexley High School.
Ownership History
Date
Name
Owned For
Owner Type
Purchase Details
Closed on
May 20, 2019
Sold by
Masarek Patti Madison and Masarek Alan
Bought by
Hirsh Richard N
Current Estimated Value
Home Financials for this Owner
Home Financials are based on the most recent Mortgage that was taken out on this home.
Original Mortgage
$418,000
Outstanding Balance
$364,243
Interest Rate
3.77%
Mortgage Type
Adjustable Rate Mortgage/ARM
Purchase Details
Closed on
Aug 31, 2018
Sold by
Stevens Noel and Stevens Nancy
Bought by
Masarek Patti Madison
Purchase Details
Closed on
Sep 15, 2016
Sold by
Bexley Gateway Plaza Ltd
Bought by
Stevens Noel and Stevens Nancy
Purchase Details
Closed on
Mar 27, 2014
Sold by
Skilken Marilyn M and Gateway Baxley
Bought by
Bexley Gateway Plaza Ltd
Purchase Details
Closed on
Dec 1, 2010
Sold by
Bexley Gateway Plaza Ltd
Bought by
Skilken Marilyn
Create a Home Valuation Report for This Property
The Home Valuation Report is an in-depth analysis detailing your home's value as well as a comparison with similar homes in the area
Home Values in the Area
Average Home Value in this Area
Purchase History
| Date | Buyer | Sale Price | Title Company |
|---|---|---|---|
| Hirsh Richard N | $612,500 | Clean Title Box | |
| Masarek Patti Madison | $645,000 | Clear Title Box | |
| Stevens Noel | $420,000 | Clean Title Box | |
| Bexley Gateway Plaza Ltd | -- | None Available | |
| Skilken Marilyn | $659,000 | Hummel Titl |
Source: Public Records
Mortgage History
| Date | Status | Borrower | Loan Amount |
|---|---|---|---|
| Open | Hirsh Richard N | $418,000 |
Source: Public Records
Tax History Compared to Growth
Tax History
| Year | Tax Paid | Tax Assessment Tax Assessment Total Assessment is a certain percentage of the fair market value that is determined by local assessors to be the total taxable value of land and additions on the property. | Land | Improvement |
|---|---|---|---|---|
| 2024 | $413 | $7,290 | $40 | $7,250 |
| 2023 | $279 | $7,280 | $35 | $7,245 |
| 2022 | $365 | $7,570 | $320 | $7,250 |
| 2021 | $250 | $7,570 | $320 | $7,250 |
| 2020 | $248 | $7,570 | $320 | $7,250 |
| 2019 | $256 | $6,860 | $280 | $6,580 |
| 2018 | $205 | $6,860 | $280 | $6,580 |
| 2017 | $118 | $6,870 | $280 | $6,590 |
| 2016 | $187 | $7,000 | $1,400 | $5,600 |
| 2015 | $188 | $7,000 | $1,400 | $5,600 |
| 2014 | $189 | $7,000 | $1,400 | $5,600 |
| 2013 | $49 | $1,400 | $1,400 | $0 |
Source: Public Records
Map
Nearby Homes
- 419 Westland Ave
- 2350 Bryden Rd
- 1000 S Dawson Ave Unit 302
- 2425 Bryden Rd
- 211 Preston Rd
- 1825-1827 Bryden Rd
- 2430 Plymouth Ave
- 572 Bulen Ave
- 1833 Franklin Ave
- 866-868 Sheridan Ave
- 1800 E Fulton St
- 1779 E Main St
- 2455 Dale Ave
- 1747 E Mound St
- 639 Bulen Ave
- 849 Lyman Ave
- 268 S Cassady Ave
- 57 Preston Rd
- 395-397 Stoddart Ave
- 751 Bulen Ave
- 500 S Parkview Ave
- 500 S Parkview Ave
- 500 S Parkview Ave
- 500 S Parkview Ave
- 500 S Parkview Ave
- 500 S Parkview Ave Unit 402
- 500 S Parkview Ave Unit 402
- 500 S Parkview Ave Unit 400
- 500 S Parkview Ave Unit DG3
- 500 S Parkview Ave Unit N7
- 500 S Parkview Ave Unit 302
- 500 S Parkview Ave Unit 204
- 500 S Parkview Ave Unit 306
- 500 S Parkview Ave Unit 306
- 500 S Parkview Ave Unit 204
- 500 S Parkview Ave Unit 303
- 500 S Parkview Ave Unit 2F
- 500 S Parkview Ave Unit D
- 500 S Parkview Ave Unit A
- 500 S Parkview Ave Unit 406