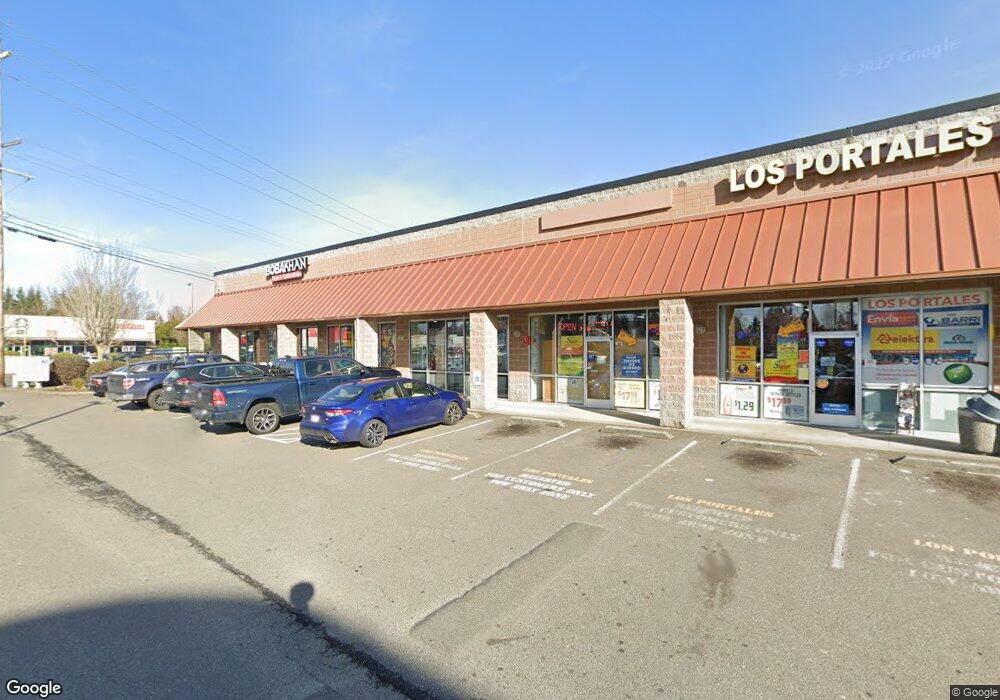
500 SE Everett Mall Way Everett, WA 98208
Everett Mall South Neighborhood
Studio
--
Bath
19,384
Sq Ft
121,968
Sq Ft Lot
About This Home
This home is located at 500 SE Everett Mall Way, Everett, WA 98208. 500 SE Everett Mall Way is a home located in Snohomish County with nearby schools including Olivia Park Elementary School, Explorer Middle School, and Mariner High School.
Ownership History
Date
Name
Owned For
Owner Type
Purchase Details
Closed on
Nov 6, 2018
Sold by
Robisnon William J
Bought by
Jkl Real Estate Investment Lp
Home Financials for this Owner
Home Financials are based on the most recent Mortgage that was taken out on this home.
Original Mortgage
$4,000,000
Outstanding Balance
$1,474,658
Interest Rate
4.7%
Mortgage Type
Construction
Purchase Details
Closed on
Feb 26, 1999
Sold by
Robinson William J and Robinson Dorothy
Bought by
Robinson Properties & Investment Llc
Home Financials for this Owner
Home Financials are based on the most recent Mortgage that was taken out on this home.
Original Mortgage
$4,500,000
Interest Rate
6.78%
Create a Home Valuation Report for This Property
The Home Valuation Report is an in-depth analysis detailing your home's value as well as a comparison with similar homes in the area
Home Values in the Area
Average Home Value in this Area
Purchase History
| Date | Buyer | Sale Price | Title Company |
|---|---|---|---|
| Jkl Real Estate Investment Lp | $6,200,000 | First American Title | |
| Robinson Properties & Investment Llc | -- | Old Republic Title Ltd |
Source: Public Records
Mortgage History
| Date | Status | Borrower | Loan Amount |
|---|---|---|---|
| Open | Jkl Real Estate Investment Lp | $4,000,000 | |
| Previous Owner | Robinson Properties & Investment Llc | $4,500,000 |
Source: Public Records
Tax History
| Year | Tax Paid | Tax Assessment Tax Assessment Total Assessment is a certain percentage of the fair market value that is determined by local assessors to be the total taxable value of land and additions on the property. | Land | Improvement |
|---|---|---|---|---|
| 2025 | $42,828 | $5,537,300 | $2,560,200 | $2,977,100 |
| 2024 | $42,828 | $5,405,100 | $2,382,700 | $3,022,400 |
| 2023 | $39,625 | $5,128,300 | $2,332,700 | $2,795,600 |
| 2022 | $33,997 | $3,808,000 | $1,359,400 | $2,448,600 |
| 2020 | $31,939 | $3,589,000 | $1,240,700 | $2,348,300 |
| 2019 | $31,606 | $3,589,000 | $992,600 | $2,596,400 |
| 2018 | $34,567 | $3,386,000 | $1,130,700 | $2,255,300 |
| 2017 | $32,914 | $3,287,500 | $1,103,500 | $2,184,000 |
| 2016 | $31,393 | $3,101,500 | $1,049,100 | $2,052,400 |
Source: Public Records
Map
Nearby Homes
- 9592 7th Ave SE
- 9612 19th Ave SE Unit A
- 728 95th Ct SE
- 10107 Meridian Ave
- 211 105th St SE
- 2 xx 106th St SE
- 901 94th St SE
- 1206 100th Ct SE Unit 11
- 10002 13th Ave SE
- 222 W Marilyn Ave
- 8930 7th Ave SE
- 8823 Holly Dr Unit 502
- 8823 Holly Dr Unit C102
- 8823 Holly Dr Unit H206
- 8823 Holly Dr Unit H204
- 225 106th St SW Unit A3
- 225 106th St SW Unit A2
- 225 106th St SW Unit A4
- 8911 Holly Dr Unit 104
- 226 93rd Place SW Unit 8
- 500 SE Everett Mall Way Unit 223
- 500 SE Everett Mall Way Unit 218
- 500 SE Everett Mall Way Unit 219
- 500 SE Everett Mall Way Unit 226
- 500 SE Everett Mall Way Unit 208
- 500 SE Everett Mall Way Unit 220
- 500 SE Everett Mall Way Unit 224
- 500 SE Everett Mall Way Unit 213
- 500 SE Everett Mall Way Unit 221
- 500 SE Everett Mall Way Unit 203
- 500 SE Everett Mall Way Unit 225
- 500 SE Everett Mall Way Unit 205
- 500 SE Everett Mall Way Unit 209
- 500 SE Everett Mall Way Unit 227
- 500 SE Everett Mall Way Unit 204
- 500 SE Everett Mall Way Unit A6
- 500 SE Everett Mall Way Unit B100
- 111527 Hwy 99 B105
- 505 100th Place SE
- 511 100th Place SE
Your Personal Tour Guide
Ask me questions while you tour the home.