500 Springfield Dr Albany, GA 31721
Estimated Value: $198,000 - $221,000
3
Beds
2
Baths
1,590
Sq Ft
$129/Sq Ft
Est. Value
About This Home
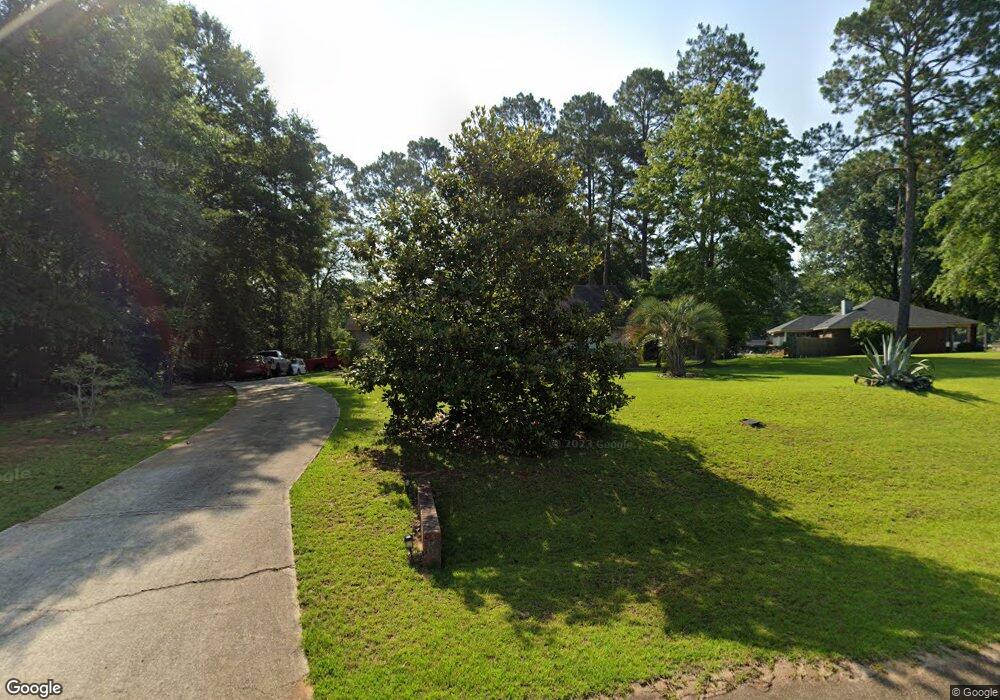
This home is located at 500 Springfield Dr, Albany, GA 31721 and is currently estimated at $205,170, approximately $129 per square foot. 500 Springfield Dr is a home located in Dougherty County with nearby schools including Live Oak Elementary School, Merry Acres Middle School, and Westover High School.
Ownership History
Date
Name
Owned For
Owner Type
Purchase Details
Closed on
Sep 28, 2007
Sold by
Lewis Carlos D
Bought by
Motley Victor T
Current Estimated Value
Home Financials for this Owner
Home Financials are based on the most recent Mortgage that was taken out on this home.
Original Mortgage
$132,288
Outstanding Balance
$83,449
Interest Rate
6.41%
Mortgage Type
VA
Estimated Equity
$121,721
Purchase Details
Closed on
Aug 27, 1997
Sold by
Roberts William Ralph
Bought by
Lewis Carlos D and Lewis Virlyn D
Purchase Details
Closed on
Jan 13, 1995
Sold by
Cobb Richard Davis and Julie Lee
Bought by
Roberts William Ralph
Purchase Details
Closed on
Oct 1, 1992
Sold by
Standard Homes Of Al
Bought by
Cobb Richard D
Purchase Details
Closed on
Aug 6, 1992
Sold by
Springfield Sec 2 Ii
Bought by
Standard Homes Of Al
Purchase Details
Closed on
May 21, 1979
Bought by
Springfield Section
Create a Home Valuation Report for This Property
The Home Valuation Report is an in-depth analysis detailing your home's value as well as a comparison with similar homes in the area
Home Values in the Area
Average Home Value in this Area
Purchase History
| Date | Buyer | Sale Price | Title Company |
|---|---|---|---|
| Motley Victor T | $128,000 | -- | |
| Lewis Carlos D | $85,000 | -- | |
| Roberts William Ralph | $82,700 | -- | |
| Cobb Richard D | $78,000 | -- | |
| Standard Homes Of Al | $13,100 | -- | |
| Springfield Section | -- | -- |
Source: Public Records
Mortgage History
| Date | Status | Borrower | Loan Amount |
|---|---|---|---|
| Open | Motley Victor T | $132,288 |
Source: Public Records
Tax History Compared to Growth
Tax History
| Year | Tax Paid | Tax Assessment Tax Assessment Total Assessment is a certain percentage of the fair market value that is determined by local assessors to be the total taxable value of land and additions on the property. | Land | Improvement |
|---|---|---|---|---|
| 2024 | $2,370 | $49,680 | $8,600 | $41,080 |
| 2023 | $2,315 | $49,680 | $8,600 | $41,080 |
| 2022 | $2,323 | $49,680 | $8,600 | $41,080 |
| 2021 | $2,154 | $49,680 | $8,600 | $41,080 |
| 2020 | $2,159 | $49,680 | $8,600 | $41,080 |
| 2019 | $2,167 | $49,680 | $8,600 | $41,080 |
| 2018 | $2,176 | $49,680 | $8,600 | $41,080 |
| 2017 | $2,027 | $49,680 | $8,600 | $41,080 |
| 2016 | $2,028 | $49,680 | $8,600 | $41,080 |
| 2015 | $2,034 | $49,680 | $8,600 | $41,080 |
| 2014 | $2,009 | $49,680 | $8,600 | $41,080 |
Source: Public Records
Map
Nearby Homes
- 505 Divine Dr
- 510 Iveys Scenic Dr
- 101 Frank Orgel Ct
- 200 Wentworth Ln
- 203 Wentworth Ln
- 210 Wentworth Ln
- 204 Wentworth Ln
- 212 Wentworth Ln
- 206 Wentworth Ln
- 216 Wentworth Ln
- 214 Wentworth Ln
- 218 Wentworth Ln
- 205 Wentworth Ln
- 220 Wentworth Ln
- 207 Wentworth Ln
- 222 Wentworth Ln
- 215 Wentworth Ln
- 224 Wentworth Ln
- 209 Wentworth Ln
- 226 Wentworth Ln
- 401 Iveys Scenic Dr
- 504 Springfield Dr
- 403 Iveys Scenic Dr
- 500 Divine Dr
- 503 Springfield Dr
- 505 Springfield Dr
- 405 Iveys Scenic Dr
- 402 Iveys Scenic Dr
- 501 Divine Dr
- 506 Springfield Dr
- 502 Divine Dr
- 404 Iveys Scenic Dr
- 503 Divine Dr
- 508 Springfield Dr
- 406 Iveys Scenic Dr
- 504 Divine Dr
- 511 Iveys Scenic Dr
- 513 Iveys Scenic Dr
- 409 Iveys Scenic Dr
- 509 Iveys Scenic Dr