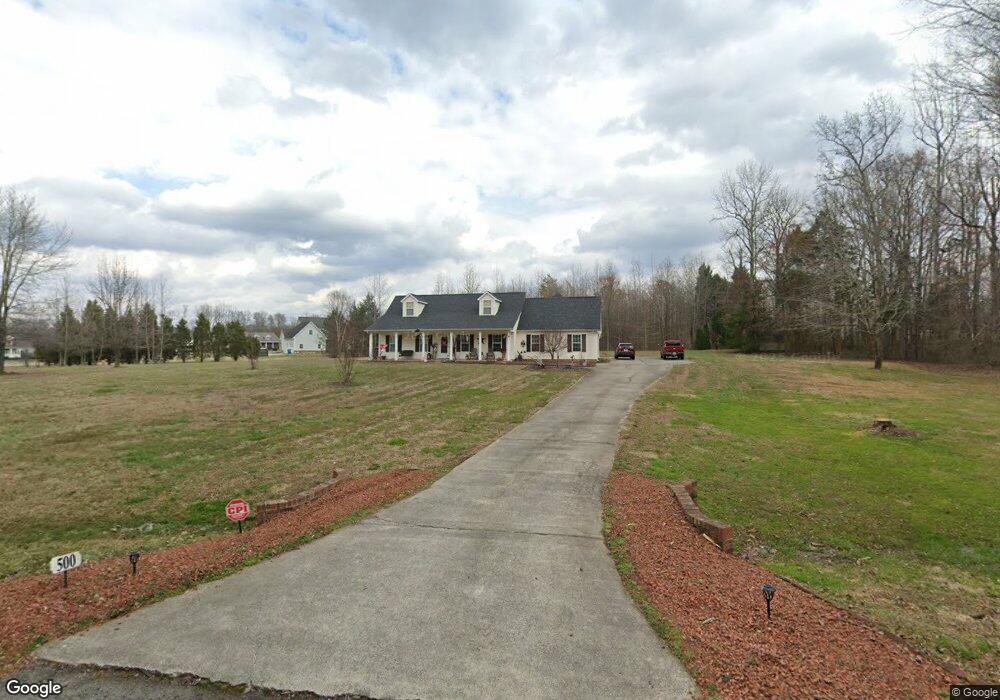
500 Steeple Chase Trail Salisbury, NC 28144
Estimated Value: $396,000 - $502,000
--
Bed
3
Baths
2,371
Sq Ft
$182/Sq Ft
Est. Value
About This Home
This home is located at 500 Steeple Chase Trail, Salisbury, NC 28144 and is currently estimated at $432,370, approximately $182 per square foot. 500 Steeple Chase Trail is a home located in Rowan County with nearby schools including North Rowan Elementary School, North Rowan Middle School, and North Rowan High School.
Ownership History
Date
Name
Owned For
Owner Type
Purchase Details
Closed on
Mar 27, 2019
Sold by
Burris Tammy D and Pilegard Edward M
Bought by
Cramsey James P and Cramsey Kimberly A
Current Estimated Value
Home Financials for this Owner
Home Financials are based on the most recent Mortgage that was taken out on this home.
Original Mortgage
$188,000
Outstanding Balance
$122,042
Interest Rate
4.3%
Mortgage Type
New Conventional
Estimated Equity
$310,328
Purchase Details
Closed on
Dec 17, 2003
Sold by
Nottingham Kevin W and Nottingham Amy S
Bought by
Pilegard Edward M and Burris Tammy D
Home Financials for this Owner
Home Financials are based on the most recent Mortgage that was taken out on this home.
Original Mortgage
$128,500
Interest Rate
5.97%
Mortgage Type
Unknown
Create a Home Valuation Report for This Property
The Home Valuation Report is an in-depth analysis detailing your home's value as well as a comparison with similar homes in the area
Home Values in the Area
Average Home Value in this Area
Purchase History
| Date | Buyer | Sale Price | Title Company |
|---|---|---|---|
| Cramsey James P | $247,500 | None Available | |
| Pilegard Edward M | $165,000 | -- |
Source: Public Records
Mortgage History
| Date | Status | Borrower | Loan Amount |
|---|---|---|---|
| Open | Cramsey James P | $188,000 | |
| Previous Owner | Pilegard Edward M | $128,500 | |
| Closed | Pilegard Edward M | $20,000 |
Source: Public Records
Tax History Compared to Growth
Tax History
| Year | Tax Paid | Tax Assessment Tax Assessment Total Assessment is a certain percentage of the fair market value that is determined by local assessors to be the total taxable value of land and additions on the property. | Land | Improvement |
|---|---|---|---|---|
| 2025 | $3,973 | $351,618 | $42,500 | $309,118 |
| 2024 | $3,973 | $351,618 | $42,500 | $309,118 |
| 2023 | $3,973 | $351,618 | $42,500 | $309,118 |
| 2022 | $2,978 | $226,884 | $33,500 | $193,384 |
| 2021 | $2,978 | $226,884 | $33,500 | $193,384 |
| 2020 | $2,978 | $226,884 | $33,500 | $193,384 |
| 2019 | $2,978 | $226,884 | $33,500 | $193,384 |
| 2018 | $2,367 | $182,356 | $33,500 | $148,856 |
| 2017 | $2,367 | $182,356 | $33,500 | $148,856 |
| 2016 | $2,367 | $182,356 | $33,500 | $148,856 |
| 2015 | $2,403 | $182,356 | $33,500 | $148,856 |
| 2014 | $2,354 | $184,181 | $33,500 | $150,681 |
Source: Public Records
Map
Nearby Homes
- 520 Steeple Chase Trail
- 529 Steeple Chase Trail
- 2350 Grubb Ferry Rd
- 2430 Grubb Ferry Rd
- 00 Hollywood Dr
- 00 Hollywood Dr Unit 14-15
- 805 N Rowan Avenue Extension
- 400 Charles St
- 0 Lincoln Ave
- 900 N Salisbury Ave
- 1204 3rd St
- 414 S Rowan Ave
- 3435 E Ridge Rd
- 174 Brown Rd
- 1059 3rd St
- none N Salisbury Ave
- 0 Hollywood Dr Unit 16 CAR4245632
- 0 Hollywood Dr Unit CAR4093261
- 415 Pinecroft Ln
- 2400 Sowers Rd
- 430 Steeple Chase Trail
- 505 Steeple Chase Trail
- 515 Steeple Chase Trail
- 510 Steeple Chase Trail
- 469 Steeple Chase Trail
- 469 Steeple Chase Trail Unit 20
- 465 Steeple Chase Trail
- 459 Steeple Chase Trail
- 420 Steeple Chase Trail
- 445 Steeple Chase Trail
- 519 Steeple Chase Trail
- 453 Steeple Chase Trail
- 435 Steeple Chase Trail
- 425 Steeple Chase Trail
- 525 Steeple Chase Trail
- 400 Steeple Chase Trail
- 405 Steeple Chase Trail
- 501 Steeple Chase Trail
- 330 Steeple Chase Trail
- 535 Steeple Chase Trail