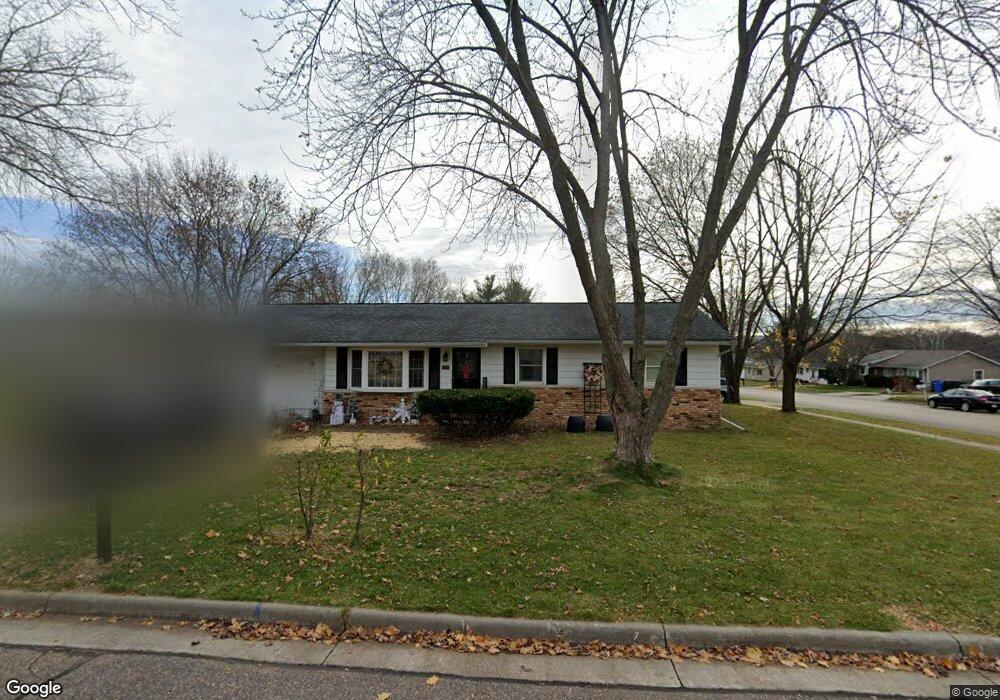
500 Tyler Ave Baraboo, WI 53913
Estimated Value: $213,000 - $246,000
3
Beds
1
Bath
1,780
Sq Ft
$129/Sq Ft
Est. Value
About This Home
This home is located at 500 Tyler Ave, Baraboo, WI 53913 and is currently estimated at $228,979, approximately $128 per square foot. 500 Tyler Ave is a home located in Sauk County with nearby schools including Baraboo High School, St. Joseph Catholic School, and St. John's Lutheran School.
Ownership History
Date
Name
Owned For
Owner Type
Purchase Details
Closed on
Jun 17, 2024
Sold by
Blue Town Llc
Bought by
Goetz Tyler T and Goetz Stephanie J
Current Estimated Value
Home Financials for this Owner
Home Financials are based on the most recent Mortgage that was taken out on this home.
Original Mortgage
$222,888
Outstanding Balance
$220,151
Interest Rate
7.22%
Mortgage Type
FHA
Estimated Equity
$8,828
Purchase Details
Closed on
Dec 31, 2004
Sold by
Zastrow David and Zastrow Thelma
Bought by
Blue Town Llc
Create a Home Valuation Report for This Property
The Home Valuation Report is an in-depth analysis detailing your home's value as well as a comparison with similar homes in the area
Home Values in the Area
Average Home Value in this Area
Purchase History
| Date | Buyer | Sale Price | Title Company |
|---|---|---|---|
| Goetz Tyler T | $227,000 | None Listed On Document | |
| Blue Town Llc | -- | None Available |
Source: Public Records
Mortgage History
| Date | Status | Borrower | Loan Amount |
|---|---|---|---|
| Open | Goetz Tyler T | $222,888 |
Source: Public Records
Tax History Compared to Growth
Tax History
| Year | Tax Paid | Tax Assessment Tax Assessment Total Assessment is a certain percentage of the fair market value that is determined by local assessors to be the total taxable value of land and additions on the property. | Land | Improvement |
|---|---|---|---|---|
| 2024 | $2,474 | $124,800 | $33,500 | $91,300 |
| 2023 | $1,258 | $124,800 | $33,500 | $91,300 |
| 2022 | $2,522 | $124,800 | $33,500 | $91,300 |
| 2021 | $2,438 | $124,800 | $33,500 | $91,300 |
| 2020 | $2,639 | $113,900 | $29,800 | $84,100 |
| 2019 | $2,973 | $113,900 | $29,800 | $84,100 |
| 2018 | $2,767 | $113,900 | $29,800 | $84,100 |
| 2017 | $2,673 | $113,900 | $29,800 | $84,100 |
| 2016 | $2,535 | $113,900 | $29,800 | $84,100 |
| 2015 | $2,484 | $113,900 | $29,800 | $84,100 |
| 2014 | $2,523 | $113,900 | $29,800 | $84,100 |
Source: Public Records
Map
Nearby Homes