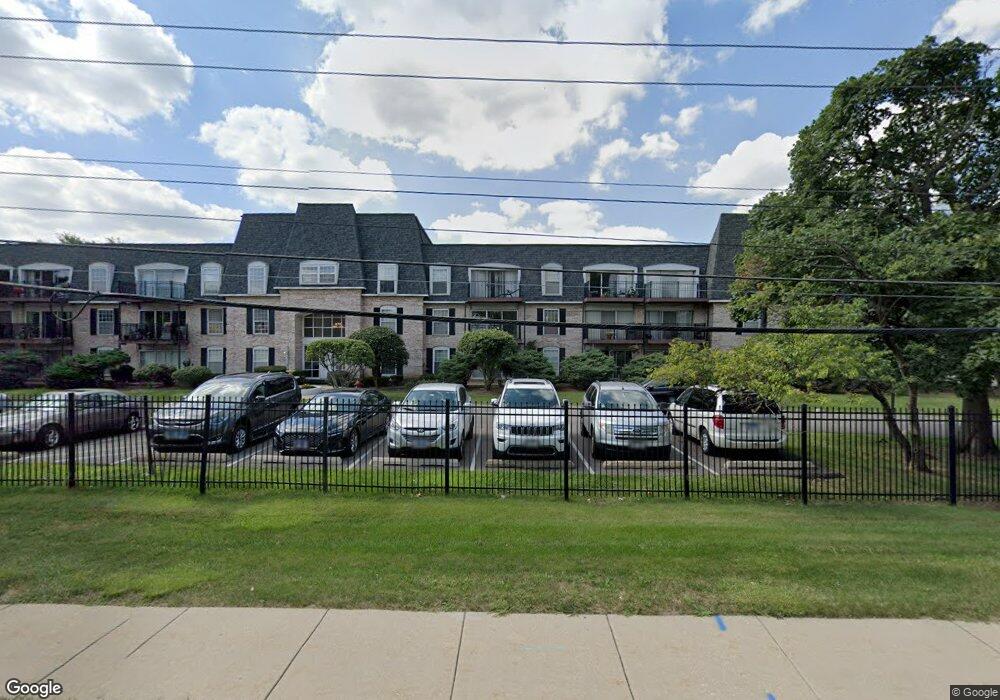
5000 Carriageway Dr Unit 202 Rolling Meadows, IL 60008
Busse Woods NeighborhoodEstimated Value: $130,000 - $209,000
2
Beds
1
Bath
1,121
Sq Ft
$162/Sq Ft
Est. Value
About This Home
This home is located at 5000 Carriageway Dr Unit 202, Rolling Meadows, IL 60008 and is currently estimated at $181,888, approximately $162 per square foot. 5000 Carriageway Dr Unit 202 is a home located in Cook County with nearby schools including Willow Bend Elementary School, Carl Sandburg Junior High School, and Rolling Meadows High School.
Ownership History
Date
Name
Owned For
Owner Type
Purchase Details
Closed on
Sep 22, 2011
Sold by
Lasalle 115 Holdings Llc Series 18 Sfr
Bought by
Savyuk Igor
Current Estimated Value
Purchase Details
Closed on
Mar 28, 2011
Sold by
Papciak Piortr and Case #2010 Ch 09537
Bought by
Harris Na
Purchase Details
Closed on
Aug 7, 2000
Sold by
Mcwhinney William R
Bought by
Papciak Piotr and Papciak Bernadeta
Home Financials for this Owner
Home Financials are based on the most recent Mortgage that was taken out on this home.
Original Mortgage
$94,050
Interest Rate
8.24%
Create a Home Valuation Report for This Property
The Home Valuation Report is an in-depth analysis detailing your home's value as well as a comparison with similar homes in the area
Home Values in the Area
Average Home Value in this Area
Purchase History
| Date | Buyer | Sale Price | Title Company |
|---|---|---|---|
| Savyuk Igor | $61,000 | None Available | |
| Lasalle 115 Holdings Llc Series 18 Sfr | -- | None Available | |
| Harris Na | -- | None Available | |
| Papciak Piotr | $97,000 | -- |
Source: Public Records
Mortgage History
| Date | Status | Borrower | Loan Amount |
|---|---|---|---|
| Previous Owner | Papciak Piotr | $94,050 |
Source: Public Records
Tax History Compared to Growth
Tax History
| Year | Tax Paid | Tax Assessment Tax Assessment Total Assessment is a certain percentage of the fair market value that is determined by local assessors to be the total taxable value of land and additions on the property. | Land | Improvement |
|---|---|---|---|---|
| 2024 | $2,709 | $12,188 | $443 | $11,745 |
| 2023 | $2,562 | $12,188 | $443 | $11,745 |
| 2022 | $2,562 | $12,188 | $443 | $11,745 |
| 2021 | $1,902 | $9,103 | $290 | $8,813 |
| 2020 | $1,930 | $9,103 | $290 | $8,813 |
| 2019 | $1,960 | $10,204 | $290 | $9,914 |
| 2018 | $1,104 | $6,859 | $249 | $6,610 |
| 2017 | $1,100 | $6,859 | $249 | $6,610 |
| 2016 | $1,283 | $6,859 | $249 | $6,610 |
| 2015 | $1,331 | $6,871 | $221 | $6,650 |
| 2014 | $1,316 | $6,871 | $221 | $6,650 |
| 2013 | $1,266 | $6,871 | $221 | $6,650 |
Source: Public Records
Map
Nearby Homes
- 2504 Algonquin Rd Unit 14
- 2502 Algonquin Rd Unit 2
- 2402 Algonquin Rd Unit 9
- 5300 Carriageway Dr Unit 302
- 2508 Algonquin Rd Unit 16
- 5500 Carriageway Dr Unit 213
- 2312 Algonquin Rd Unit 3
- 2950 Northampton Dr Unit B1
- 5451 Elizabeth Place Unit 906
- 1217 S Old Wilke Rd Unit 11110
- 1217 S Old Wilke Rd Unit 11406
- 1227 S Old Wilke Rd Unit 306
- 1860 W Surrey Park Ln Unit 1C
- 1207 S Old Wilke Rd Unit 303
- 1322 S New Wilke Rd Unit 1C
- 1206 S New Wilke Rd Unit 108
- 1117 S Old Wilke Rd Unit 206
- 1306 S New Wilke Rd Unit 2B
- 1107 S Old Wilke Rd Unit 201
- 5600 Astor Ln Unit 103
- 5000 Carriageway Dr Unit 308
- 5000 Carriageway Dr Unit 116
- 5000 Carriageway Dr Unit 302
- 5000 Carriageway Dr Unit 307-1
- 5000 Carriageway Dr Unit 216
- 5000 Carriageway Dr Unit 208
- 5000 Carriageway Dr Unit 103
- 5000 Carriageway Dr Unit 207-1
- 5000 Carriageway Dr Unit P39
- 5000 Carriageway Dr Unit P10
- 5000 Carriageway Dr Unit P41
- 5000 Carriageway Dr Unit P22
- 5000 Carriageway Dr Unit P43
- 5000 Carriageway Dr Unit P9
- 5000 Carriageway Dr Unit P37
- 5000 Carriageway Dr Unit 317
- 5000 Carriageway Dr Unit 309
- 5000 Carriageway Dr Unit 210
- 5000 Carriageway Dr Unit 102
- 5000 Carriageway Dr Unit P28