Estimated Value: $598,000 - $731,701
4
Beds
4
Baths
3,612
Sq Ft
$182/Sq Ft
Est. Value
About This Home
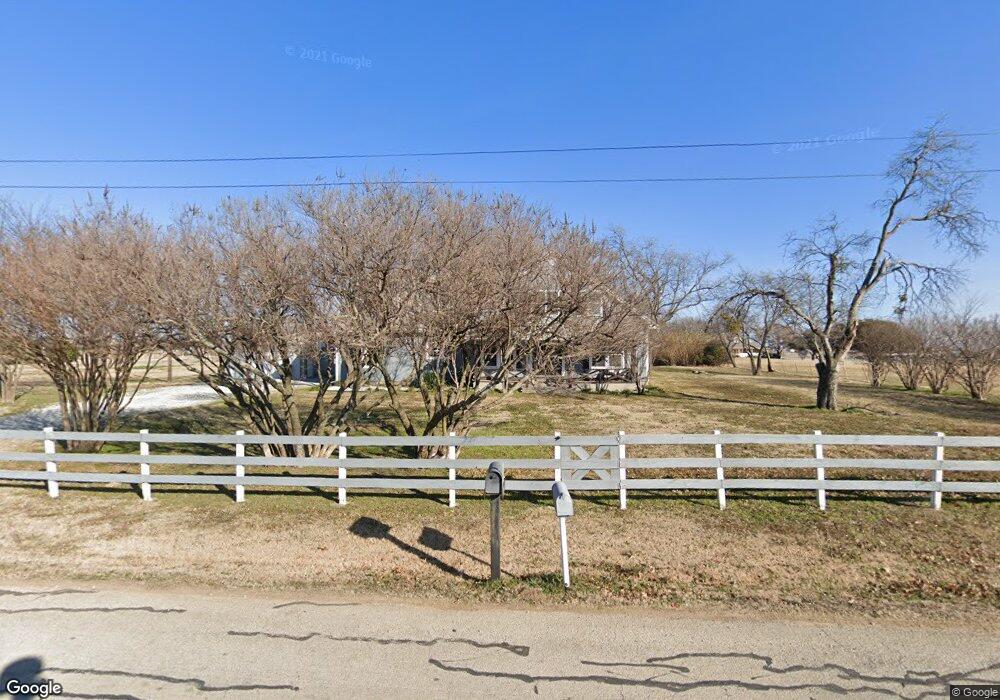
This home is located at 5000 Jackson Rd, Krum, TX 76249 and is currently estimated at $656,925, approximately $181 per square foot. 5000 Jackson Rd is a home located in Denton County with nearby schools including Krum Early Education Center, Blanche Dodd Intermediate School, and Krum Middle School.
Ownership History
Date
Name
Owned For
Owner Type
Purchase Details
Closed on
Oct 5, 2017
Sold by
O Securities Management Inc
Bought by
Chance Coleman James
Current Estimated Value
Home Financials for this Owner
Home Financials are based on the most recent Mortgage that was taken out on this home.
Original Mortgage
$288,000
Outstanding Balance
$240,819
Interest Rate
3.86%
Mortgage Type
New Conventional
Estimated Equity
$416,106
Purchase Details
Closed on
Nov 17, 2016
Sold by
Jarrell Bryan and Jarrell Charla
Bought by
O Securities Management Inc
Home Financials for this Owner
Home Financials are based on the most recent Mortgage that was taken out on this home.
Original Mortgage
$241,500
Interest Rate
3.47%
Mortgage Type
Purchase Money Mortgage
Purchase Details
Closed on
Oct 14, 2005
Sold by
Ginn Arnold M and Ginn Cecilia F
Bought by
Jarrell Bryan and Jarrell Charla
Create a Home Valuation Report for This Property
The Home Valuation Report is an in-depth analysis detailing your home's value as well as a comparison with similar homes in the area
Home Values in the Area
Average Home Value in this Area
Purchase History
| Date | Buyer | Sale Price | Title Company |
|---|---|---|---|
| Chance Coleman James | -- | None Available | |
| O Securities Management Inc | -- | St | |
| Jarrell Bryan | -- | -- |
Source: Public Records
Mortgage History
| Date | Status | Borrower | Loan Amount |
|---|---|---|---|
| Open | Chance Coleman James | $288,000 | |
| Previous Owner | O Securities Management Inc | $241,500 |
Source: Public Records
Tax History
| Year | Tax Paid | Tax Assessment Tax Assessment Total Assessment is a certain percentage of the fair market value that is determined by local assessors to be the total taxable value of land and additions on the property. | Land | Improvement |
|---|---|---|---|---|
| 2025 | $4,934 | $479,160 | $174,240 | $458,760 |
| 2024 | $6,175 | $435,600 | $0 | $0 |
| 2023 | $4,387 | $396,000 | $165,437 | $395,563 |
| 2022 | $5,886 | $360,000 | $35,000 | $325,000 |
| 2021 | $5,440 | $346,477 | $35,000 | $311,477 |
| 2020 | $5,275 | $326,174 | $35,000 | $291,174 |
| 2019 | $5,825 | $329,921 | $35,000 | $294,921 |
| 2018 | $6,400 | $359,965 | $35,000 | $324,965 |
| 2017 | $3,406 | $190,457 | $35,000 | $155,457 |
| 2016 | $3,104 | $173,552 | $35,000 | $138,552 |
| 2015 | $2,494 | $168,679 | $59,000 | $109,679 |
| 2013 | -- | $158,406 | $59,000 | $99,406 |
Source: Public Records
Map
Nearby Homes
- 5276 Albert Ct
- 5258 Albert Ct
- 334 Saddlebrook Dr
- 1606 Withers Way
- 1636 Tin Roof Rd
- 1645 Tin Roof Rd
- 1628 Tin Roof Rd
- 1616 Tin Roof Rd
- 205 Comanche Trail
- 5516 Rollins Dr
- 1604 Tin Roof Rd
- 5520 Rollins Dr
- 5524 Rollins Dr
- 5528 Rollins Dr
- 5532 Rollins Dr
- 1516 Tin Roof Rd
- 8540 W University Dr
- 5540 Rollins Dr
- 5404 Flannel Ln
- 1512 Tin Roof Rd
- 5001 Jackson Rd
- 5050 Jackson Rd
- 1 Jackson Rd E
- 4915 Jackson Rd
- 5091 Jackson Rd
- 5287 Albert Ct
- 4847 Jackson Rd
- 5257 Albert Ct
- 5243 Albert Ct
- 5287 Maria Cristina Ct
- 1996 Thomas j Egan Rd
- 5297 Albert Ct
- 5297 Maria Cristina Ct
- 5213 Albert Ct
- 2154 Hillview Dr
- 5293 Albert Ct
- 2184 Hillview Dr
- 5296 Maria Cristina Ct
- 2292 Hillview Dr
- 5226 Maria Cristina Ct
Your Personal Tour Guide
Ask me questions while you tour the home.