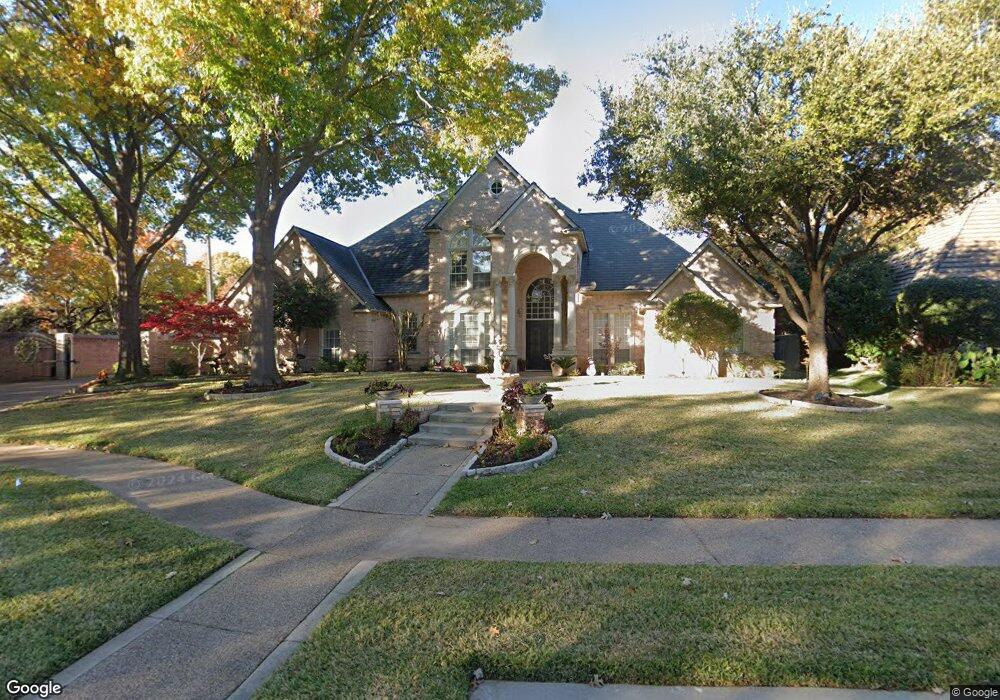
5000 Westgrove Ln Colleyville, TX 76034
Estimated Value: $1,083,000 - $1,244,416
5
Beds
5
Baths
3,923
Sq Ft
$300/Sq Ft
Est. Value
About This Home
This home is located at 5000 Westgrove Ln, Colleyville, TX 76034 and is currently estimated at $1,177,354, approximately $300 per square foot. 5000 Westgrove Ln is a home located in Tarrant County with nearby schools including O.C. Taylor Elementary School, Colleyville Middle School, and Waypoint Montessori.
Ownership History
Date
Name
Owned For
Owner Type
Purchase Details
Closed on
Jun 21, 2021
Sold by
Vanzant Carmen J
Bought by
Gaston Cynthia G
Current Estimated Value
Purchase Details
Closed on
Jul 20, 2020
Sold by
Edwards Craig B and Edwards Lisa
Bought by
Gaston Cynthia Graciela and Limosnero Rachelle Dulce
Home Financials for this Owner
Home Financials are based on the most recent Mortgage that was taken out on this home.
Original Mortgage
$510,000
Interest Rate
3.2%
Mortgage Type
New Conventional
Purchase Details
Closed on
Jun 7, 2005
Sold by
Lamb Marcus and Lamb Joni
Bought by
Edwards Craig B
Home Financials for this Owner
Home Financials are based on the most recent Mortgage that was taken out on this home.
Original Mortgage
$250,000
Interest Rate
5.76%
Mortgage Type
Fannie Mae Freddie Mac
Create a Home Valuation Report for This Property
The Home Valuation Report is an in-depth analysis detailing your home's value as well as a comparison with similar homes in the area
Home Values in the Area
Average Home Value in this Area
Purchase History
| Date | Buyer | Sale Price | Title Company |
|---|---|---|---|
| Gaston Cynthia G | -- | First American Title Ins Co | |
| Gaston Cynthia Graciela | -- | Fatico | |
| Edwards Craig B | -- | Alamo Title Company |
Source: Public Records
Mortgage History
| Date | Status | Borrower | Loan Amount |
|---|---|---|---|
| Previous Owner | Gaston Cynthia Graciela | $510,000 | |
| Previous Owner | Edwards Craig B | $250,000 |
Source: Public Records
Tax History Compared to Growth
Tax History
| Year | Tax Paid | Tax Assessment Tax Assessment Total Assessment is a certain percentage of the fair market value that is determined by local assessors to be the total taxable value of land and additions on the property. | Land | Improvement |
|---|---|---|---|---|
| 2025 | $4,162 | $1,085,000 | $267,790 | $817,210 |
| 2024 | $4,162 | $1,164,190 | $267,790 | $896,400 |
| 2023 | $15,675 | $946,983 | $267,790 | $679,193 |
| 2022 | $16,738 | $847,468 | $267,790 | $579,678 |
| 2021 | $16,865 | $767,982 | $185,580 | $582,402 |
| 2020 | $15,159 | $682,175 | $185,580 | $496,595 |
| 2019 | $15,580 | $673,889 | $175,000 | $498,889 |
| 2018 | $3,917 | $658,886 | $140,000 | $518,886 |
| 2017 | $14,304 | $605,457 | $140,000 | $465,457 |
| 2016 | $14,185 | $600,422 | $140,000 | $460,422 |
| 2015 | $12,803 | $592,200 | $100,000 | $492,200 |
| 2014 | $12,803 | $592,200 | $100,000 | $492,200 |
Source: Public Records
Map
Nearby Homes
- 2906 Edgewood Ln
- 4282 Hearthside Dr
- 2906 Cottonwood Ln
- 4214 Hearthside Dr
- 4213 Hearthside Dr
- 3321 Circlewood Ct
- 3301 Queensbury Way W
- 3278 Birch Ave
- 3329 Moss Creek Dr
- 3409 Crossgate Cir N
- 4309 Meandering Way
- 4300 Eaton Cir
- 4723 Bill Simmons Rd
- 5134 Post Oak Trail
- 3701 Post Oak Trail
- 4816 Bill Simmons Rd
- 2904 Hickory Hill Ln
- 3712 Bur Oak Dr
- 3705 Rothschild Blvd
- 3216 Glade Rd
- 5002 Westgrove Ln
- 5004 Westgrove Ln
- 2900 Glade Rd
- 2908 Meadowview Dr
- 2912 Meadowview Dr
- 5001 Westgrove Ln
- 2904 Meadowview Dr
- 2916 Meadowview Dr
- 5003 Westgrove Ln
- 5006 Westgrove Ln
- 2900 Meadowview Dr
- 2920 Meadowview Dr
- 5005 Westgrove Ln
- 2808 Meadowview Dr
- 4905 Shadycreek Ln
- 2903 Highgrove Ct
- 5007 Westgrove Ln
- 2901 Highgrove Ct
- 3000 Meadowview Ct
- 2911 Meadowview Dr