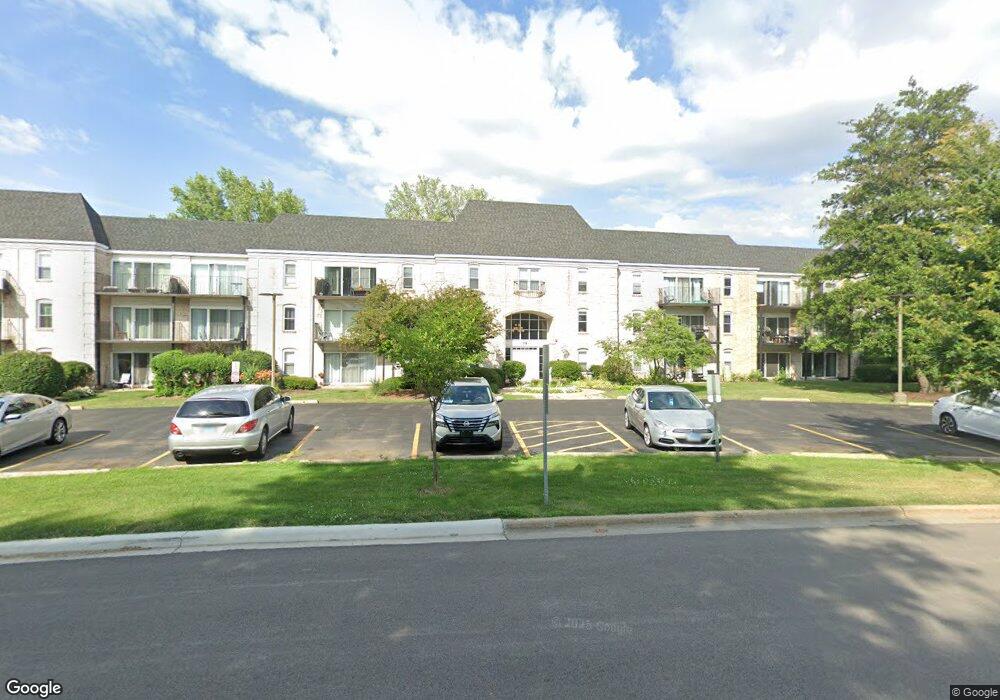
5001 Carriageway Dr Unit A31 Rolling Meadows, IL 60008
Busse Woods NeighborhoodEstimated Value: $128,000 - $145,156
1
Bed
1
Bath
800
Sq Ft
$171/Sq Ft
Est. Value
About This Home
This home is located at 5001 Carriageway Dr Unit A31, Rolling Meadows, IL 60008 and is currently estimated at $136,539, approximately $170 per square foot. 5001 Carriageway Dr Unit A31 is a home located in Cook County with nearby schools including Willow Bend Elementary School, Gale School, and Carl Sandburg Junior High School.
Ownership History
Date
Name
Owned For
Owner Type
Purchase Details
Closed on
Dec 23, 2024
Sold by
Obara Wanda and Obara Alexander
Bought by
Infinity Homes Chicago Llc
Current Estimated Value
Purchase Details
Closed on
Nov 20, 2020
Sold by
Kim Susan and Kim Susan Hyun
Bought by
Obara Wanda
Home Financials for this Owner
Home Financials are based on the most recent Mortgage that was taken out on this home.
Original Mortgage
$72,675
Interest Rate
3.62%
Mortgage Type
New Conventional
Purchase Details
Closed on
Aug 12, 2016
Sold by
Fiore Lorenzo
Bought by
Kim Susan
Purchase Details
Closed on
Mar 14, 2002
Sold by
Prokopowicz Bogumila
Bought by
Fiore Lorenzo and Fiore Romilda
Purchase Details
Closed on
Sep 2, 1999
Sold by
Niedermeyer Debra and Severyn Debra N
Bought by
Prokopowicz Bogumila
Create a Home Valuation Report for This Property
The Home Valuation Report is an in-depth analysis detailing your home's value as well as a comparison with similar homes in the area
Home Values in the Area
Average Home Value in this Area
Purchase History
| Date | Buyer | Sale Price | Title Company |
|---|---|---|---|
| Infinity Homes Chicago Llc | $131,000 | None Listed On Document | |
| Obara Wanda | $97,000 | Baird & Warner Ttl Svcs Inc | |
| Kim Susan | $78,000 | Chicago Title | |
| Fiore Lorenzo | $102,000 | Stewart Title | |
| Prokopowicz Bogumila | $77,000 | -- |
Source: Public Records
Mortgage History
| Date | Status | Borrower | Loan Amount |
|---|---|---|---|
| Previous Owner | Obara Wanda | $72,675 |
Source: Public Records
Tax History Compared to Growth
Tax History
| Year | Tax Paid | Tax Assessment Tax Assessment Total Assessment is a certain percentage of the fair market value that is determined by local assessors to be the total taxable value of land and additions on the property. | Land | Improvement |
|---|---|---|---|---|
| 2024 | $2,717 | $8,897 | $1,105 | $7,792 |
| 2023 | $2,599 | $8,897 | $1,105 | $7,792 |
| 2022 | $2,599 | $8,897 | $1,105 | $7,792 |
| 2021 | $2,294 | $6,963 | $725 | $6,238 |
| 2020 | $1,242 | $6,963 | $725 | $6,238 |
| 2019 | $1,273 | $7,828 | $725 | $7,103 |
| 2018 | $899 | $6,223 | $621 | $5,602 |
| 2017 | $899 | $6,223 | $621 | $5,602 |
| 2016 | $1,831 | $6,223 | $621 | $5,602 |
| 2015 | $1,781 | $5,685 | $552 | $5,133 |
| 2014 | $2,008 | $6,566 | $552 | $6,014 |
| 2013 | $1,960 | $6,566 | $552 | $6,014 |
Source: Public Records
Map
Nearby Homes
- 5200 Carriageway Dr Unit 101
- 2504 Algonquin Rd Unit 14
- 2504 Algonquin Rd Unit 17
- 2402 Algonquin Rd Unit 9
- 5500 Carriageway Dr Unit 213
- 2508 Algonquin Rd Unit 16
- 2930 Northampton Dr Unit A2
- 2312 Algonquin Rd Unit 3
- 1217 S Old Wilke Rd Unit 11406
- 1227 S Old Wilke Rd Unit 201
- 1227 S Old Wilke Rd Unit 306
- 1207 S Old Wilke Rd Unit 303
- 5552 Elizabeth Place Unit 3102
- 1206 S New Wilke Rd Unit 108
- 1820 W Surrey Park Ln Unit 1B
- 1306 S New Wilke Rd Unit 2B
- 1117 S Old Wilke Rd Unit 206
- 5550 Astor Ln Unit 317
- 5600 Astor Ln Unit 315
- 2503 Fulle St Unit 17
- 5001 Carriageway Dr Unit 115
- 5001 Carriageway Dr Unit 109
- 5001 Carriageway Dr Unit A21
- 5001 Carriageway Dr Unit A11
- 5001 Carriageway Dr Unit 130
- 5001 Carriageway Dr Unit 6
- 5001 Carriageway Dr Unit A20
- 5001 Carriageway Dr Unit 112
- 5001 Carriageway Dr Unit A31
- 5001 Carriageway Dr Unit A10
- 5001 Carriageway Dr Unit 106
- 5001 Carriageway Dr Unit A11
- 5001 Carriageway Dr Unit 145
- 5001 Carriageway Dr Unit 121
- 5001 Carriageway Dr Unit A11
- 5001 Carriageway Dr Unit 133
- 5001 Carriageway Dr Unit 131
- 5001 Carriageway Dr Unit 148
- 5001 Carriageway Dr Unit 161
- 5001 Carriageway Dr Unit 122