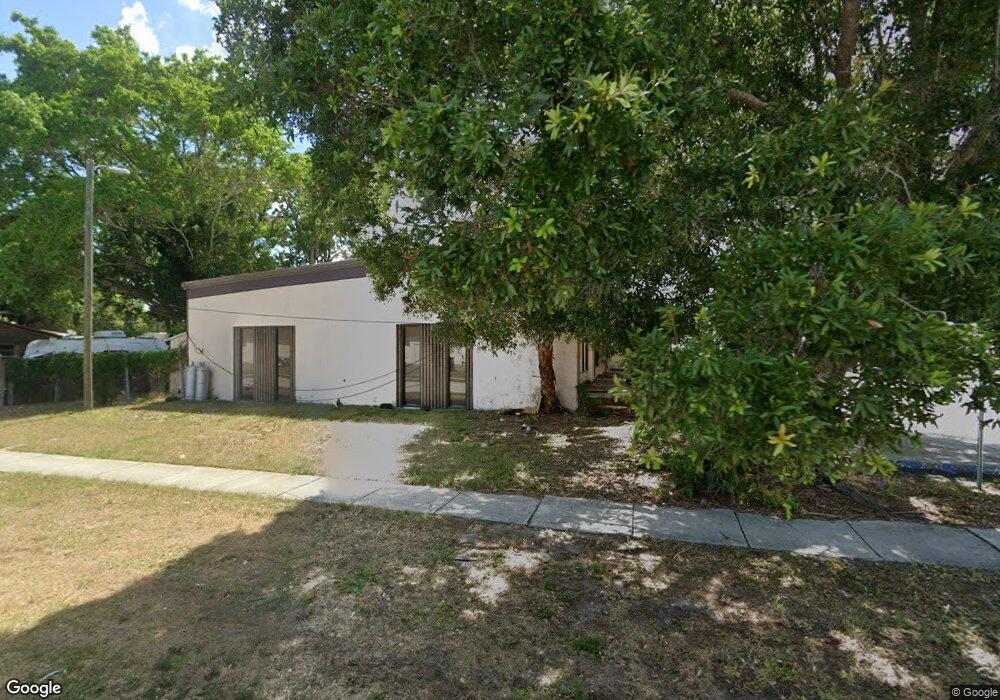
5002 73rd Ave N Pinellas Park, FL 33781
Estimated Value: $1,054,006
--
Bed
1
Bath
4,000
Sq Ft
$264/Sq Ft
Est. Value
About This Home
This home is located at 5002 73rd Ave N, Pinellas Park, FL 33781 and is currently estimated at $1,054,006, approximately $263 per square foot. 5002 73rd Ave N is a home located in Pinellas County with nearby schools including Pinellas Park Elementary School, Pinellas Park Middle School, and Hollins High School.
Ownership History
Date
Name
Owned For
Owner Type
Purchase Details
Closed on
Oct 5, 2005
Sold by
Nair Govindan P
Bought by
Velasquez Alex and Velasquez Marta
Current Estimated Value
Home Financials for this Owner
Home Financials are based on the most recent Mortgage that was taken out on this home.
Original Mortgage
$488,000
Outstanding Balance
$3,402
Interest Rate
5.72%
Mortgage Type
Purchase Money Mortgage
Estimated Equity
$1,050,604
Purchase Details
Closed on
Mar 17, 1998
Sold by
Tlc Holding Co Inc
Bought by
Nair Govindan P
Purchase Details
Closed on
Oct 31, 1996
Sold by
Wise Jack L and Wise Judith
Bought by
Tlc Holding Co Inc
Home Financials for this Owner
Home Financials are based on the most recent Mortgage that was taken out on this home.
Original Mortgage
$140,000
Interest Rate
8.15%
Mortgage Type
Purchase Money Mortgage
Create a Home Valuation Report for This Property
The Home Valuation Report is an in-depth analysis detailing your home's value as well as a comparison with similar homes in the area
Home Values in the Area
Average Home Value in this Area
Purchase History
| Date | Buyer | Sale Price | Title Company |
|---|---|---|---|
| Velasquez Alex | $535,000 | Gulfport Central Title Compa | |
| Nair Govindan P | $240,400 | -- | |
| Tlc Holding Co Inc | $160,000 | -- |
Source: Public Records
Mortgage History
| Date | Status | Borrower | Loan Amount |
|---|---|---|---|
| Open | Velasquez Alex | $488,000 | |
| Previous Owner | Tlc Holding Co Inc | $400,000 | |
| Previous Owner | Tlc Holding Co Inc | $140,000 |
Source: Public Records
Tax History Compared to Growth
Tax History
| Year | Tax Paid | Tax Assessment Tax Assessment Total Assessment is a certain percentage of the fair market value that is determined by local assessors to be the total taxable value of land and additions on the property. | Land | Improvement |
|---|---|---|---|---|
| 2024 | $8,226 | $425,000 | $178,211 | $246,789 |
| 2023 | $8,226 | $405,000 | $163,274 | $241,726 |
| 2022 | $7,509 | $360,000 | $148,722 | $211,278 |
| 2021 | $6,867 | $310,000 | $0 | $0 |
| 2020 | $5,937 | $270,000 | $0 | $0 |
| 2019 | $5,983 | $270,000 | $113,578 | $156,422 |
| 2018 | $5,803 | $260,000 | $0 | $0 |
| 2017 | $5,767 | $255,000 | $0 | $0 |
| 2016 | $5,731 | $250,000 | $0 | $0 |
| 2015 | $5,868 | $250,000 | $0 | $0 |
| 2014 | $5,857 | $248,600 | $0 | $0 |
Source: Public Records
Map
Nearby Homes
- 7151 51st St N
- 5060 76th Ave N Unit 110
- 6940 47th Way N
- 6680 49th Way N
- 4741 76th Ave N
- 5380 77th Ave N
- 4742 68th Terrace N
- 4638 69th Place N
- 7645 55th St N
- 6857 46th Way N
- 6801 46th Ln N
- 7141 56th St N
- 6841 46th St N
- 4676 66th Place N
- 5503 67th Ave N Unit 18
- 4330 72nd Terrace N
- 5680 77th Ave N
- 5301 82nd Ave N
- 5712 78th Ave N
- 5685 67th Ave N Unit 113
- 5022 73rd Ave N
- 5032 73rd Ave N
- 5046 73rd Ave N Unit 5046
- 7200 50th St N
- 5007 72nd Ave N
- 5047 72nd Ave N
- 5071 72nd Ave N
- 5081 72nd Ave N
- 5010 Park Blvd N
- 5141 72nd Ave N Unit A
- 5141 72nd Ave N Unit B
- 5141 72nd Ave N
- 4994 Park Blvd
- 7198 51st St N
- 4970 Park Blvd N
- 7180 51st St N
- 5001 71st Ave N
- 5031 71st Ave N
- 5049 71st Ave N
- 7160 51st St N