Estimated Value: $408,000 - $450,503
3
Beds
2
Baths
1,808
Sq Ft
$236/Sq Ft
Est. Value
About This Home
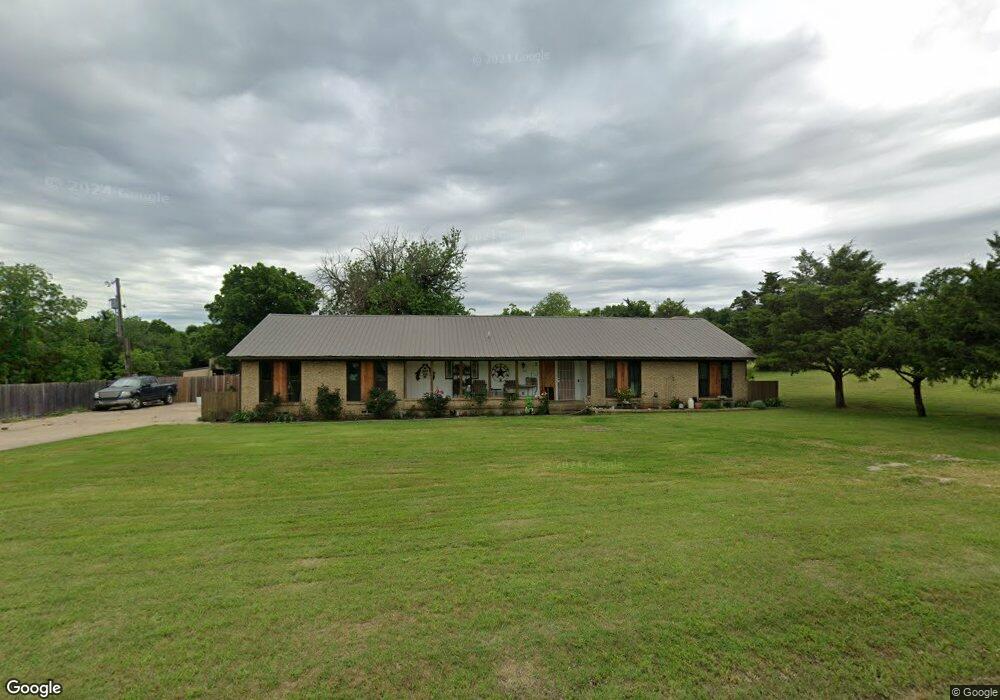
This home is located at 5002 Bennett Rd, Wylie, TX 75098 and is currently estimated at $427,376, approximately $236 per square foot. 5002 Bennett Rd is a home located in Collin County with nearby schools including P M Akin Elementary School, AB Harrison Intermediate School, and Grady Burnett J High School.
Ownership History
Date
Name
Owned For
Owner Type
Purchase Details
Closed on
Jan 6, 2004
Sold by
Aufforth Gary
Bought by
Christiana Suzanne and Christiana Michael
Current Estimated Value
Home Financials for this Owner
Home Financials are based on the most recent Mortgage that was taken out on this home.
Original Mortgage
$155,000
Outstanding Balance
$72,286
Interest Rate
5.86%
Mortgage Type
Purchase Money Mortgage
Estimated Equity
$355,090
Purchase Details
Closed on
Jan 2, 2004
Sold by
Aufforth Lisa Janelle Radmore
Bought by
Aufforth Gary
Home Financials for this Owner
Home Financials are based on the most recent Mortgage that was taken out on this home.
Original Mortgage
$155,000
Outstanding Balance
$72,286
Interest Rate
5.86%
Mortgage Type
Purchase Money Mortgage
Estimated Equity
$355,090
Purchase Details
Closed on
Oct 30, 1998
Sold by
Aufforth Albert and Aufforth Sieglinde
Bought by
Aufforth Gary and Aufforth Lisa J
Home Financials for this Owner
Home Financials are based on the most recent Mortgage that was taken out on this home.
Original Mortgage
$118,750
Interest Rate
6.61%
Create a Home Valuation Report for This Property
The Home Valuation Report is an in-depth analysis detailing your home's value as well as a comparison with similar homes in the area
Home Values in the Area
Average Home Value in this Area
Purchase History
| Date | Buyer | Sale Price | Title Company |
|---|---|---|---|
| Christiana Suzanne | -- | Commonwealth Land Title Co | |
| Aufforth Gary | -- | Commonwealth Land Title Co | |
| Aufforth Gary | -- | -- |
Source: Public Records
Mortgage History
| Date | Status | Borrower | Loan Amount |
|---|---|---|---|
| Open | Christiana Suzanne | $155,000 | |
| Previous Owner | Aufforth Gary | $118,750 |
Source: Public Records
Tax History Compared to Growth
Tax History
| Year | Tax Paid | Tax Assessment Tax Assessment Total Assessment is a certain percentage of the fair market value that is determined by local assessors to be the total taxable value of land and additions on the property. | Land | Improvement |
|---|---|---|---|---|
| 2025 | $2,512 | $292,206 | $161,216 | $188,090 |
| 2024 | $2,512 | $265,642 | $161,216 | $281,645 |
| 2023 | $2,512 | $241,493 | $161,216 | $322,305 |
| 2022 | $3,582 | $219,539 | $161,216 | $166,784 |
| 2021 | $3,411 | $221,000 | $110,391 | $110,609 |
| 2020 | $3,256 | $190,113 | $67,089 | $123,024 |
| 2019 | $3,137 | $164,943 | $60,990 | $123,123 |
| 2018 | $2,867 | $149,948 | $60,990 | $88,958 |
| 2017 | $2,928 | $153,158 | $60,990 | $92,168 |
| 2016 | $2,790 | $148,789 | $60,990 | $87,799 |
| 2015 | $2,311 | $131,452 | $60,990 | $70,462 |
Source: Public Records
Map
Nearby Homes
- 2607 Waverly Dr
- 2605 Waverly Dr
- 2608 Waverly Dr
- 2603 Waverly Dr
- 2606 Waverly Dr
- 2601 Waverly Dr
- 2609 Ackley Ln
- Santa Fe Plan at Kreymer at the Park
- Omaha Plan at Kreymer at the Park
- Glasgow Plan at Kreymer at the Park
- Mykonos Plan at Kreymer at the Park
- Malmo Plan at Kreymer at the Park
- Cordoba Plan at Kreymer at the Park
- Rotterdam Plan at Kreymer at the Park
- 2603 Ackley Ln
- 2601 Ackley Ln
- 121 Touchstone Rd
- 3548 Beaumont Dr
- 2316 Whitney Ln
- 194 Touchstone Rd
- 5012 Bennett Rd
- 5022 Bennett Rd
- 2840 E Stone Rd
- 2830 E Stone Rd
- 5032 Bennett Rd
- 2820 E Stone Rd
- 5042 Bennett Rd
- 2845 E Stone Rd
- 2810 E Stone Rd
- 2835 E Stone Rd
- 200 Palmdale Dr
- 5052 Bennett Rd
- 2800 E Stone Rd
- 2815 E Stone Rd
- 202 Palmdale Dr
- 204 Palmdale Dr
- 2775 E Stone Rd
- 206 Palmdale Dr
- 2938 Jamestown Dr
- 5062 Bennett Rd