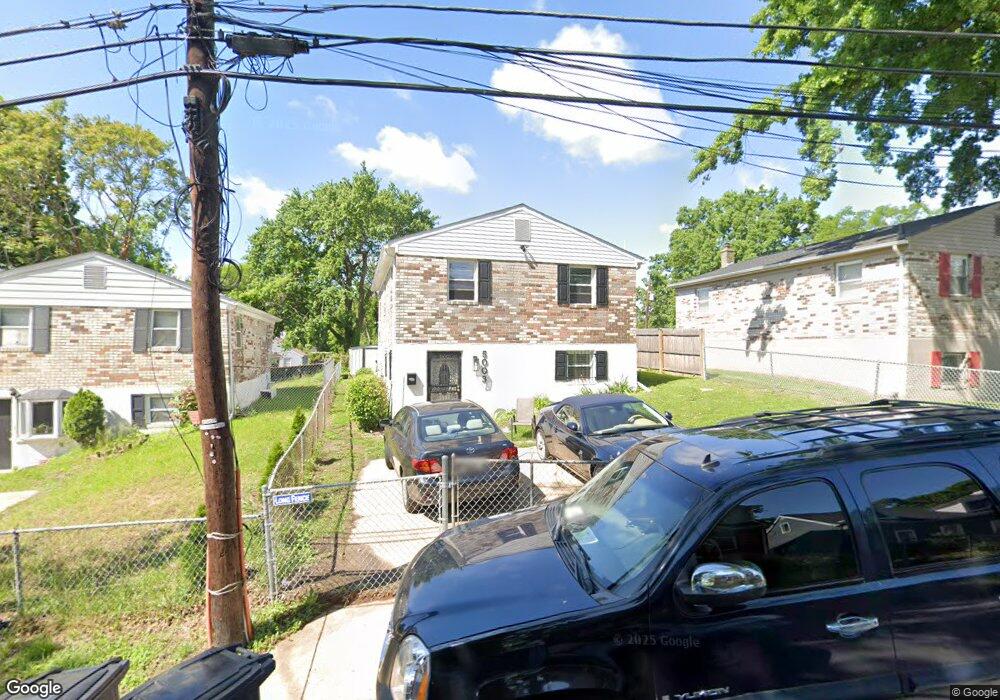
5003 Emo St Capitol Heights, MD 20743
Estimated Value: $327,000 - $365,348
5
Beds
2
Baths
816
Sq Ft
$418/Sq Ft
Est. Value
About This Home
This home is located at 5003 Emo St, Capitol Heights, MD 20743 and is currently estimated at $340,837, approximately $417 per square foot. 5003 Emo St is a home located in Prince George's County with nearby schools including William W. Hall Academy, Suitland High School, and DC Scholars Public Charter School.
Ownership History
Date
Name
Owned For
Owner Type
Purchase Details
Closed on
Nov 16, 2021
Sold by
Stanley Andrea P
Bought by
Stanley Willie K and Stanley Clifton C
Current Estimated Value
Home Financials for this Owner
Home Financials are based on the most recent Mortgage that was taken out on this home.
Original Mortgage
$183,000
Interest Rate
2.27%
Mortgage Type
New Conventional
Purchase Details
Closed on
Jul 8, 2021
Sold by
Estate Of Esther Mae Stanley
Bought by
Stanley Andrea P and Stanley Regina
Purchase Details
Closed on
Oct 23, 1979
Sold by
Morano James
Bought by
Stanley Clifton C and Stanley Esther M
Create a Home Valuation Report for This Property
The Home Valuation Report is an in-depth analysis detailing your home's value as well as a comparison with similar homes in the area
Home Values in the Area
Average Home Value in this Area
Purchase History
| Date | Buyer | Sale Price | Title Company |
|---|---|---|---|
| Stanley Willie K | $145,752 | None Listed On Document | |
| Stanley Andrea P | -- | None Available | |
| Stanley Clifton C | $43,000 | -- |
Source: Public Records
Mortgage History
| Date | Status | Borrower | Loan Amount |
|---|---|---|---|
| Previous Owner | Stanley Willie K | $183,000 |
Source: Public Records
Tax History
| Year | Tax Paid | Tax Assessment Tax Assessment Total Assessment is a certain percentage of the fair market value that is determined by local assessors to be the total taxable value of land and additions on the property. | Land | Improvement |
|---|---|---|---|---|
| 2025 | $4,426 | $297,867 | -- | -- |
| 2024 | $4,426 | $271,033 | -- | -- |
| 2023 | $4,027 | $244,200 | $60,000 | $184,200 |
| 2022 | $3,878 | $234,200 | $0 | $0 |
| 2021 | $3,459 | $224,200 | $0 | $0 |
| 2020 | $6,783 | $214,200 | $45,000 | $169,200 |
| 2019 | $2,915 | $203,533 | $0 | $0 |
| 2018 | $2,720 | $192,867 | $0 | $0 |
| 2017 | $2,914 | $182,200 | $0 | $0 |
| 2016 | -- | $169,300 | $0 | $0 |
| 2015 | $2,410 | $156,400 | $0 | $0 |
| 2014 | $2,410 | $143,500 | $0 | $0 |
Source: Public Records
Map
Nearby Homes
Your Personal Tour Guide
Ask me questions while you tour the home.