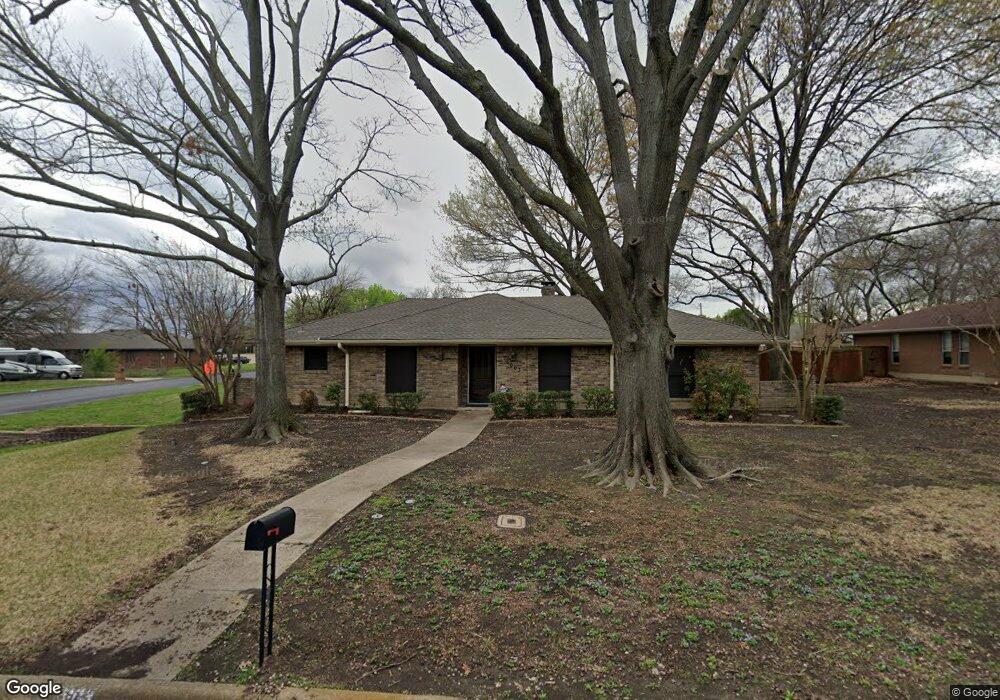
5003 Jefferson Dr Sachse, TX 75048
Estimated Value: $413,910 - $457,000
4
Beds
3
Baths
2,072
Sq Ft
$211/Sq Ft
Est. Value
About This Home
This home is located at 5003 Jefferson Dr, Sachse, TX 75048 and is currently estimated at $436,228, approximately $210 per square foot. 5003 Jefferson Dr is a home located in Dallas County with nearby schools including Firewheel Christian Academy, Oakhill Day School, and Pinnacle Montessori of Sachse.
Ownership History
Date
Name
Owned For
Owner Type
Purchase Details
Closed on
Apr 17, 2017
Sold by
Stauffer Clifford L and Stauffer Clifford Lyyn
Bought by
Bailey Rachele
Current Estimated Value
Home Financials for this Owner
Home Financials are based on the most recent Mortgage that was taken out on this home.
Original Mortgage
$216,000
Outstanding Balance
$179,744
Interest Rate
4.21%
Mortgage Type
New Conventional
Estimated Equity
$256,484
Purchase Details
Closed on
Dec 16, 2016
Sold by
Deal Clifforrd Brandon and Deal Margie
Bought by
Dean Clifford Brandon
Home Financials for this Owner
Home Financials are based on the most recent Mortgage that was taken out on this home.
Original Mortgage
$157,500
Interest Rate
3.57%
Mortgage Type
New Conventional
Purchase Details
Closed on
Nov 8, 2013
Sold by
Verble Linda T
Bought by
Stauffer Clifford L
Create a Home Valuation Report for This Property
The Home Valuation Report is an in-depth analysis detailing your home's value as well as a comparison with similar homes in the area
Home Values in the Area
Average Home Value in this Area
Purchase History
| Date | Buyer | Sale Price | Title Company |
|---|---|---|---|
| Bailey Rachele | -- | None Available | |
| Dean Clifford Brandon | -- | None Available | |
| Stauffer Clifford L | -- | Nat |
Source: Public Records
Mortgage History
| Date | Status | Borrower | Loan Amount |
|---|---|---|---|
| Open | Bailey Rachele | $216,000 | |
| Previous Owner | Dean Clifford Brandon | $157,500 |
Source: Public Records
Tax History
| Year | Tax Paid | Tax Assessment Tax Assessment Total Assessment is a certain percentage of the fair market value that is determined by local assessors to be the total taxable value of land and additions on the property. | Land | Improvement |
|---|---|---|---|---|
| 2025 | $7,070 | $411,300 | $95,000 | $316,300 |
| 2024 | $7,070 | $411,300 | $95,000 | $316,300 |
| 2023 | $7,070 | $404,660 | $95,000 | $309,660 |
| 2022 | $7,918 | $330,940 | $95,000 | $235,940 |
| 2021 | $7,453 | $289,610 | $60,000 | $229,610 |
| 2020 | $7,577 | $289,610 | $60,000 | $229,610 |
| 2019 | $6,722 | $236,970 | $55,000 | $181,970 |
| 2018 | $6,787 | $236,970 | $55,000 | $181,970 |
| 2017 | $6,591 | $229,500 | $55,000 | $174,500 |
| 2016 | $4,961 | $172,740 | $40,000 | $132,740 |
| 2015 | $4,016 | $149,390 | $28,300 | $121,090 |
| 2014 | $4,016 | $149,390 | $28,300 | $121,090 |
Source: Public Records
Map
Nearby Homes
- 5007 Jefferson Dr
- 6018 Raleigh Dr
- 1306 Norfolk Ct
- 5534 Dearborn Ln
- 2402 Ash Ln
- 1217 Wynne Dr
- 2418 Ash Ln
- 5703 Pecan Grove Dr
- 1407 Ponderosa Dr
- 2209 Vicksburg Dr
- 2104 Ponderosa Trail
- 2416 Rebecca Dr
- 5418 Riverwalk Pkwy
- 913 Clack Dr
- 1226 Donegal Ln
- 6313 O Ryans Cir
- 5413 Brookhollow Dr
- 6408 Hilltop Trail
- 2809 Southridge Dr
- 2405 3rd St
- 5014 Murphy Rd
- 5002 Jefferson Dr
- 1604 Cornwall Ln
- 5011 Jefferson Dr
- 1606 Cornwall Ln
- 5006 Jefferson Dr
- 5006 Murphy Rd
- 1608 Cornwall Ln
- 5010 Jefferson Dr
- 5105 Jefferson Dr
- 5001 Natchez Dr
- 5100 Murphy Rd
- 5003 Natchez Dr
- 5104 Jefferson Dr
- 6001 Murphy Rd
- 1704 Cornwall Ln
- 6005 Murphy Rd
- 5005 Natchez Dr
- 5229 Natchez Dr
- 1708 Cornwall Ln
Your Personal Tour Guide
Ask me questions while you tour the home.